E-Paper



The poor are driving India’s demographic trends now | Number Theory
.

 Prefer HTon Google


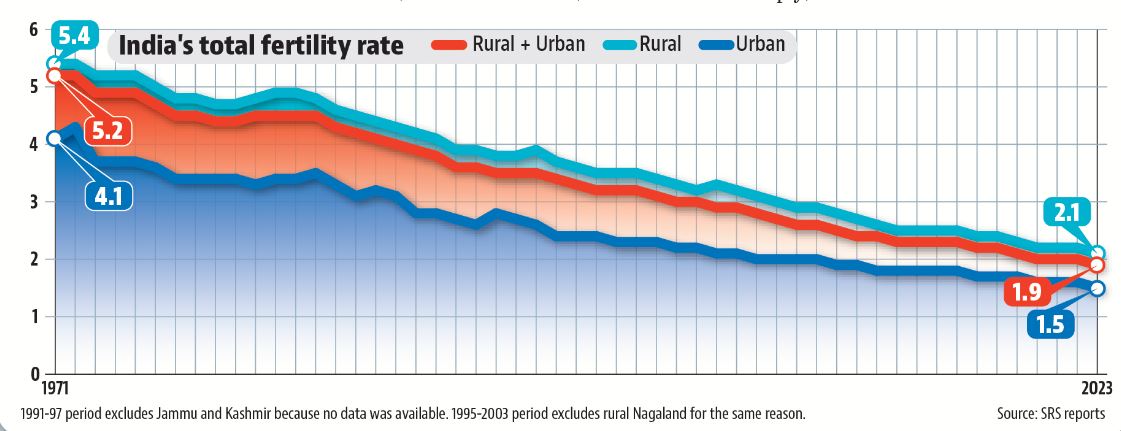
The latest results from the Sample Registration System (SRS) mark an important milestone in India's demographic trajectory. Total fertility rate (TFR) - it is the average number of children a woman has in her lifetime - in India's rural areas touched 2.1 for the first time in 2023. A TFR of 2.1 is considered replacement level fertility, which ensures a stable population if maintained over a long time. SRS is the most authoritative source of demographic trends in India apart from the census and used in a host of calculations. While SRS does not give a breakup of data beyond a state-level or rural-urban, the National Family and Health Surveys (NFHS) suggest that the latest flattening in India's demographic curve is a result of the poor having fewer children.
 Most of the recent fall in overall TFR is due to rural TFRIndia’s overall TFR touched and then fell below the critical 2.1 threshold in 2019 and 2020, respectively. To be sure, overall TFR has been on a falling trajectory since 1973 itself, two years after the beginning of the SRS series in 1971. A comparison of rural and urban TFR numbers shows that most of the recent fall in overall TFR has been on account of a fall in rural TFR numbers. Urban TFR, in fact, fell to 2.1 in 2004, has been below 2.1 since 2006, and reached 1.5 in the 2023 round. Rural TFR, on the other hand, has fallen more sharply, from 3.3 in 2004 to 2.1 in 2023.
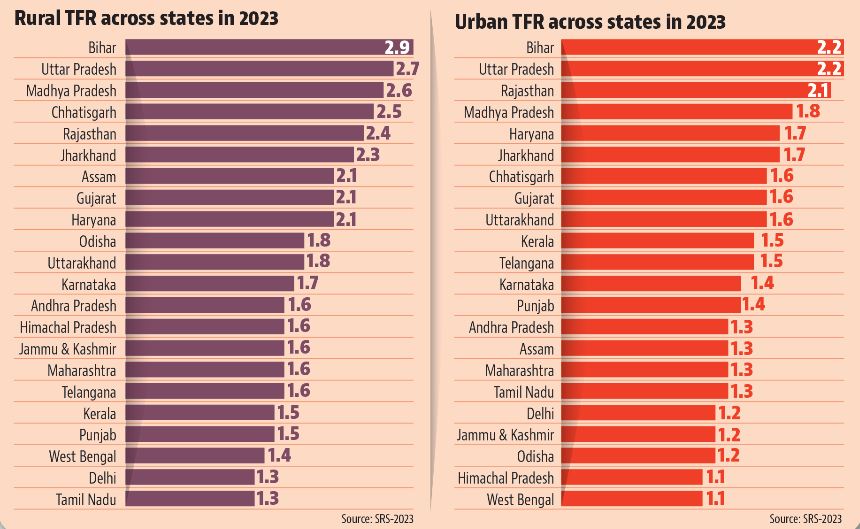
- Out of India’s 22 large states, 13 now have below replacement level TFR in both rural and urban areasAs is to be expected, there exist large-scale variations in TFR across Indian states. The SRS gives state-level TFR for 22 bigger states and UTs by population. In the 2023 round, 16 out of these 22 had overall TFR below 2.1. This number was 19 in urban TFR and 13 in rural TFR, with 13 having below replacement level TFR in both. What is important, however, is the fact that even states with TFR above replacement level have been showing a decline in this number, both in rural and urban areas.
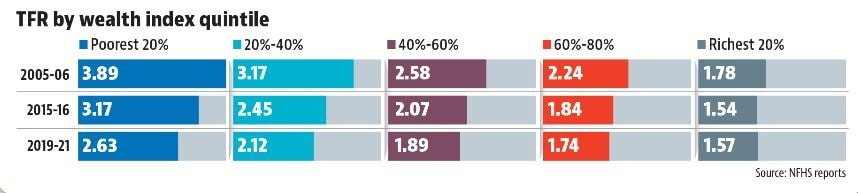
- What is even more important is the class-wise trend in TFRThis is where the latest NFHS data, from the 2019-21 round, is useful. NFHS classifies households according to wealth levels, which gives a relative ranking of households by ownership rather than value of assets. This classification is available for the last three NFHS rounds conducted in 2019-21, 2015-16 and 2005-06. The 1998-99 round of the NFHS classified households into three asset groups, while such a classification did not exist for the first round of the NFHS conducted in 1992-93. The data shows that the richest households in India have had TFR levels at or below replacement level since 1998-99 itself. By the 2019-21 round of the NFHS, the top 60% of the households had TFR levels below replacement levels and only the bottom 20% of the population had TFR above the critical threshold of 2.1.
- What does all of this mean for the larger political economy around demography in India?The most important is that India needs to prepare itself for a phase where the population will first stabilise and then start declining. According to the United Nations’ 2024 population projections, the growth rate of India’s population has already slowed down from a CAGR of 2.33% in 1950-60 to 0.98% in 2015-25; and it will start declining from 2062. The other key takeaway is that even the poor, who are still dependent on manual work and not a part of India’s high-paying formal economy, have taken to having fewer children, either out of economic concerns or to align themselves with the social nudge for controlling fertility. Unless incomes rise for them to compensate for the loss of working hands, which is what fertility is for the poor in any economy, things may become difficult rather than easier for a majority of Indians going forward.