Who is economically privileged in India is a question which can evoke strong views. The empirical basis for answering this question is not so easy. India does not have official data on income distribution. The consumption expenditure survey, which is often taken as a proxy for income in India, significantly undercounts the rich. Sources such as the income tax returns database are released at a very summary level and do not lend themselves to granular analysis. The problem becomes even
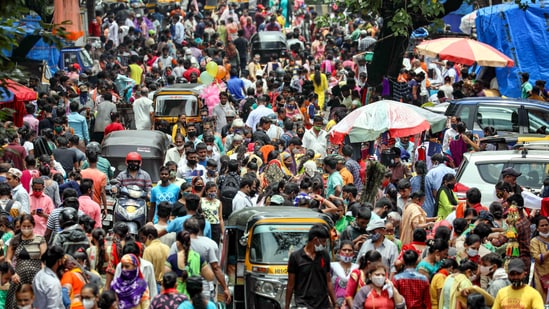
A crowded market in Mumbai. (PTI File Photo)
Who’s backward? Who’s not?
Who is more likely to be doing MGNREGS work or working outdoors?
A lot of welfare benefits in India are allegedly cornered by people who do not need them (or so goes the popular narrative). When it comes to such things as subsidised provisioning of goods (food grains) or assets (houses or LPG cylinders) it makes economic sense for a non-eligible person to try and get them. However, there is one welfare scheme in India which is extremely unlikely to see non-deserving claimants. It is the Mahatma Gandhi National Rural Employment Guarantee Scheme (MGNREGS) which entails doing manual work in villages for what are often lower than market minimum wages. Unless a person is really desperate and unskilled to do any other work, it is unlikely that they would ever take up MGNREGS work. Data from the Periodic Labour Force Survey (PLFS) asks people whether they worked in MGNREGS. While the overall share of reported MGNREGS workers is not very large – responses were only sought on the basis of work done in the past week – a comparison of social group wise relative shares shows that Scheduled Tribe (ST), Scheduled Caste (SC) and even Other Backward Classes (OBCs) have a much higher share of MGNREGS workers than non-SC-ST-OBCs. Almost a similar trend can be seen in the relative share of casual workers (most insecure and least paying) and those who work outdoors (such as farmers in villages or street vendors in cities).
Whose children are more likely to be malnourished?
The presence of malnourishment in children under five years, seen in indicators such as prevalence of stunting (low height for age) or wasting (low weight or height), is very likely to be a result of the economic inability of a family to buy adequate food for their children. Data from the 2019-21 National Family and Health Survey (NFHS) shows that SC and ST children are more likely to suffer from wasting and stunting than non-SC-ST-OBC or even OBC children.
Who is more likely to have a non-college educated family members in every generation?
Education is perhaps the biggest factor in inter-generational upward mobility. Being born to parents who did not go to college is likely to be a big disadvantage in the next generation’s professional advancement. The NSSO report on Household Consumption of Education in India allows us to look at the educational qualification of household members in every generation. The data shows that SC-ST groups have a large disadvantage when it comes to relative share in first generation household members who went to college. While the disadvantage exists for younger cohorts (second and third generations) as well, it has come down compared to the first. To be sure, the database does not have three generations (grandparents, parents, children) in every household, which is defined as a group that lives together and eats food from the same kitchen in NSSO surveys, rather than a family.
Abhishek Jha is Assistant Editor-Data at Hindustan Times. He uses statistical programming to generate newsworthy insights from large datasets. He is part of the team that produces Number Theory, a daily data story feature of the paper’s print edition. Since March 2024, he has been writing Weather Bee, a weekly column for the Hindustan Times website. He is a chemical engineer by training, who specialises in stories related to weather, climate, and the environment. Jha has been at HT since 2018, where he offers data-driven perspective and analysis on politics, environment, weather, climate, economy and society. His work includes data coverage of elections in India and abroad, including the 2019 and 2024 Lok Sabha elections; the disasters and extreme weather resulting from changing climate, such as floods, droughts, heat waves, cold waves, and dwindling snow cap in the Himalayas; the factors that drive poor air quality in northern India; the changing patterns of land use; the Covid-19 pandemic and its impact on labour market conditions; the changing pattern of consumer spending seen in the new consumer spending surveys; and social norms seen in the surveys such as the National Family Health Survey.
Roshan Kishore is the Data and Political Economy Editor at Hindustan Times. He heads the newsroom's data journalism team, which produces Number Theory, a daily data-driven feature for the print edition and the HT app. Number Theory uses data analysis and story-telling based on it to add value to the newsroom’s daily coverage by putting stories in a larger context on a range of issues, including politics, macroeconomy, markets, global affairs and climate. Under his leadership HT’s data journalism work has established itself as a niche product in Indian journalism and pushed the boundaries of marrying academic rigour with news sense and speed. Along with writing and editing data stories, he has also been writing a weekly political economy column called Terms of Trade for HT Premium. A trained economist with an MPhil degree from Jawaharlal Nehru University, Kishore has also been a visiting fellow at the Centre for Advanced Studies of India (CASI) at the University of Pennsylvania. Along with his journalistic work, his writings have also appeared in journals such as the Economic and Political Weekly and working papers for CASI and UNESCAP.
Unlock a world of Benefits with HT! From insightful newsletters to real-time news alerts and a personalized news feed – it's all here, just a click away! -Login Now!
Unlock a world of Benefits with HT! From insightful newsletters to real-time news alerts and a personalized news feed – it's all here, just a click away! -Login Now!