E-Paper



Explaining the declining household burden of health spending in India
The latest report of National Health Accounts (NHA) – it has data for 2018-19 – shows that the burden of health spending on Indian households continues to reduce.

 Prefer HTon Google


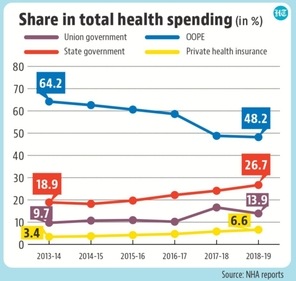
The latest report of National Health Accounts (NHA) – it has data for 2018-19 – shows that the burden of health spending on Indian households continues to reduce. The share of Out of Pocket (OOP) health spending in total health spending stood at 48.2% in 2018-19, more than 10 percentage points lower than the 58.7% value for 2016-17. This number was 64.2% for 2013-14. What has led to this sharp reduction in share of OOP health spending? An HT analysis suggests that while rising government spending has played a role, there could be statistical factors at play as well. Here are five charts which explain this argument in detail.

The 2017-18 OOP spending share puzzle is key to understanding this
We have systematic and continuous NHA numbers from 2013-14. They show that share of OOP health spending has been coming down every year. The falling trend notwithstanding, 2017-18 seems like an abnormal year in the OOP share pattern, given the sharp fall in this number.
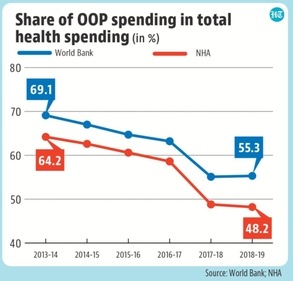
What explains such a large fall in share of OOP in total health spending in just one year? This question becomes even more pertinent given the fact that World Bank data on share of OOP spending also shows a similar sharp decline although World Bank estimates of OOP spending are higher than in the NHA.
A new NSO survey on health consumption could be the reason
It is possible that the sharp fall in OOP share in 2017-18 is more methodology driven than a reflection of the actual situation on the ground. NHA estimates OOP spending from National Statistical Office’s (NSO) health consumption survey, which has been conducted only twice since 2014. NHA reports till 2016-17 rely on the 2014 NSO survey, while NHA reports from 2017-18 onwards -- the year which shows a very large fall in OOP share -- uses the 2017-18 NSO survey. It is likely that the World Bank data also uses the NSO numbers for its calculations.
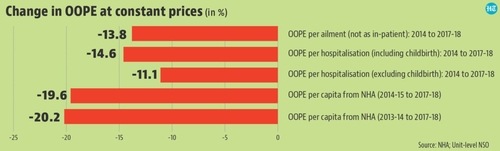
While a comparison of the exact estimation methodology which is used to extrapolate NSO data into NHA data on OOP spending is beyond the scope of this article, a preliminary comparison does suggest that the NHA report tends to overestimate the decline in health spending. This can be seen from the fact that the decline in per capita OOP spending in the NHA is greater than the decline in per ailment spending seen in the NSO report. Logically speaking, the explanation for such a decline can be an assumption that people are falling ill less often.
These debates should not undermine the importance of the rise in government spending on health
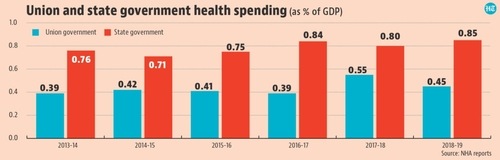
While the debate over exact decline in OOP spending is an academic question which can only be resolved with better and more frequent data collection, this should not undermine the contribution of higher government spending on reducing the burden of health spending on households. As can be seen in Chart 1, it is higher government spending and not private health insurance which has plugged the gap for falling OOP spending on health between 2013-14 and 2018-19. This is exactly why the marginal fall in health spending as a share of GDP in 2018-19 should be a matter of concern. What is also worth keeping in mind is the fact that the health spending burden could have increased significantly after the pandemic.
How does India fare in terms of OOP spending burden internationally?
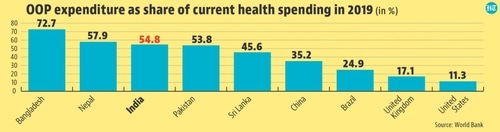
Despite the improvements in households’ OOP spending for healthcare, India is among the laggards. According to World Bank estimates for 2019, OOP spending was 54.78% of total health spending in India. This puts India among the top 25% of countries by share of OOP spending in total health spending. To be sure, high OOP spending is a problem across lower middle income countries such as India, with the average for this group being 48.2%. Bangladesh fares worse, with 73% of health spending in the country being OOP spending. However, upper middle income countries with whom India wishes to compete, such as China and Brazil, fare better. China’s OOP expenditure was 35.2% of its total health spending in 2019, while in Brazil, this proportion was 24.9%.