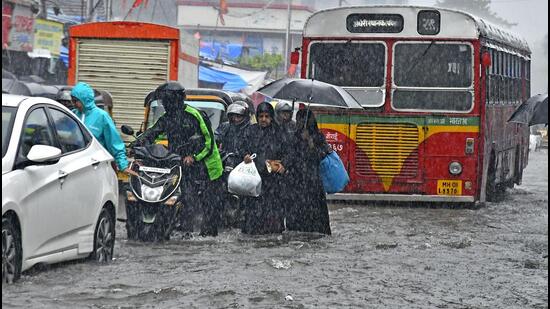
Matunga, Wadala most vulnerable to flooding; Chembur, Govandi prone to urban heat: MCAP
Malad (P/North ward) is the least vulnerable in case of flooding, with just 15.4% of its population likely to be impacted
Mumbai: Areas of Matunga, Antop Hill, Wadala and Sion are likely to be the worst affected during monsoon flooding, with 66.8% of the population of the corresponding F/North administrative ward living in a 250-meter radius of the flood-prone zone, the vulnerability and risk assessment conducted for Mumbai Climate Action Plan (MCAP) has revealed. It also shows that only 32% of the population of this ward is likely to have access to healthcare during a flood.

On the other hand, Malad (P/North ward) is the least vulnerable in case of flooding, with just 15.4% of its population likely to be impacted, according to MCAP. Overall, 35% of Mumbai’s population lives within 250 meters of BMC identified flooding hotspots.
The areas of Govandi and Mankhurd (M/East ward) are the most vulnerable from exposure to urban heat, with over 40% of its population exposed to a surface temperature greater than 35°C. The A ward corresponding to Colaba, Cuff Parade, Nariman Point and Churchgate, is likely the least vulnerable from exposure to urban heat, with only 0.92% of its population impacted.
Lubaina Rangwala, the program head of the urban development and resilience team at World Resources Institute (WRI), said, “The vulnerability risk assessment is indicative and not absolute. The data shows the probability of risk and does not present it as a certainty. The idea to conduct a risk assessment was because the city needs to internalise vulnerability assessment in its planning processes. Some areas are more vulnerable than others, so while carrying out future planning, the authorities can look at which areas to densify, which to de-densify, and come up with dedicated planning interventions based on local risk factors. This also needs to be updated time and again.”
Analysis has been done for climate risk, demographic impact, socioeconomic aspects, physical aspects, and infrastructure services aspects.
These parameters have been examined with 18 indicators - such as urban heat; urban flooding; access to urban open spaces, sanitation, drinking water, electricity, mass transit, healthcare, and fire services; gender imbalance. These have been divided into 35 parameters - such as population impacted by urban heat risk, flooding, sex ratio, effective literacy.
The M/East ward has emerged as the most vulnerable in case of 18 of the above mentioned 35 parameters, faring the worst for households with access to tap water from the treated source, taps within the household, latrine within the household, effective literacy rate, female literacy rate, sewage disposal, wastewater disposal, access to LPG, access to sources of information such as TV, mobile phone, landline phone, and a computer with internet.
The M/East ward is the most vulnerable in terms of access to a flood shelter, with only 13.5% of its population having access to a flood shelter during flooding, and 31.5% of its population having access on a normal day.
Among other conclusions of the vulnerability assessment, during flooding, only 10% of the population of Bandra West (H/West) is likely to have access to mass transportation within a one-kilometre radius, while only 15% of the H/west ward population is likely to have access to fire services during floods.
In the case of the S ward, (Bhandup area) only 38.9% of the population is likely to have access to fire rescue services on a regular day, making it the most vulnerable in this parameter.
Among other findings, C ward corresponding to areas of Marine lines, Charni Road, and Girgaon has the worst sex ratio of 695, whereas R/Central ward corresponding to Borivali has the best sex ratio of 944. Mumbai’s average sex ratio is 852.
Regarding MCAP’s findings on population impacted by flooding in F/North ward, Nikhil Desai, a civic activist who is also a resident of Matunga, said, “From 2005, year after year, flooding has taken place in this area, and none of the measures undertaken by BMC has managed to mitigate it. Moreover, every year, more area gets inundated. For 15 years residents have gone through this. It is time there is accountability and decisive policy to mitigate flooding.”
Rohit Shinkre, city-based urban planner and architect said, “The vulnerability assessment is extensive and across varied parameters, some of which are more urgent than others. This assessment will be useful while making policy decisions or undertaking development work. But the civic body must find a way to connect all dots across all the parameters and find medians for effective policy and development work.”


