E-Paper



Number Theory: How different are elites in China and America?
Research by a group of academics from a project which was started in 2022 gives some important insights into this question

 Prefer HTon Google


The world’s largest and second largest economies, US and China, have declared economic war on each other. Unlike a military war, this is a war where elites, not millions of soldiers are planning and trading attacks. This also means that the similarities and differences between the elites of these two countries will matter in how this battle is fought or resolved. How different are the American and Chinese elite? The former is the world’s oldest democracy and the biggest capitalist power while the latter is a communist country with highly developed production structures today but also one which only started tasting economic success a few decades ago. Research by a group of academics from a project which was started in 2022 gives some important insights into this question.
Firstly, a note on the data
The World Elite Database (WED), a work in progress to quantify the attributes of global elite, currently covers 16 countries which count for 74% of the world’s billionaires, 54% of global GDP and 33% of world’s population. While the database has US and China it does not have India. WED defines the economic elite as comprising of three main groups: top executives of major companies, both listed (criterion 1A) and unlisted (criterion 1B); individuals on national rich lists (criterion 2); and policymakers or officials who shape economic regulation (criterion 3). This classification also means that categories 1A or 1B can naturally overlap with 2 in case of family-run companies. It should be noted that all data for China and the US is as of end-2020.
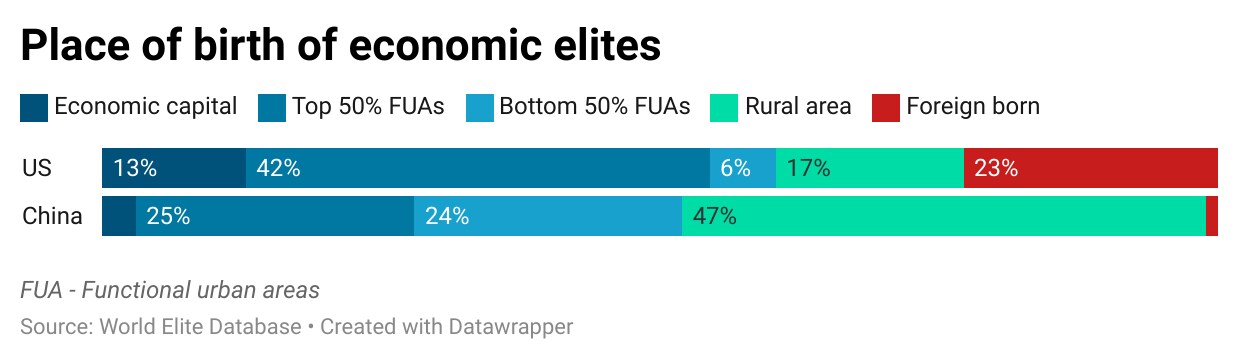
 Almost half of Chinese elites have rural origins, American elites tend to come from urban, even foreign backgroundsThe backgrounds of American and Chinese elites reveal some of the most striking differences between the two groups. In the US, 42% of elites were born in the top 50% of functional urban areas—defined by the EU-OECD as cities and their surrounding commuting zones, based on population density and travel-to-work flows—with 13% born in the country’s economic capital, defined as home to its largest stock exchange. Only about 17% come from rural areas. In contrast, 47% of Chinese elites come from rural backgrounds, while just 3% were born in the economic capital and 25% in the top 50% of functional urban areas. Another notable difference is the proportion of foreign-born elites in both countries. In the US, as much as 23% of the elites are foreign born, while this figure stands at just 1% in China.
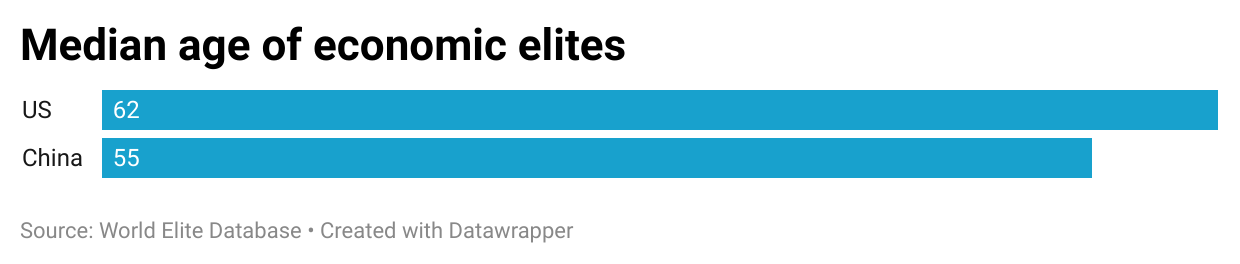
- The Chinese elites are also younger…American economic elites are the oldest among the 16 countries studied, with a median age of 62, while Chinese elites are the youngest, with a median age of 55. In China, 7% of elites are under the age of 40. It is also one of only two countries—alongside Poland—where individuals selected under criterion 3 form the oldest subgroup. “It is plausible that the age of economic elites might be related to the timing of integration of their country in the (post-Cold War) world economy or to its position at either the core or the periphery of the global network of corporate interlocks and career hubs,” said the report.
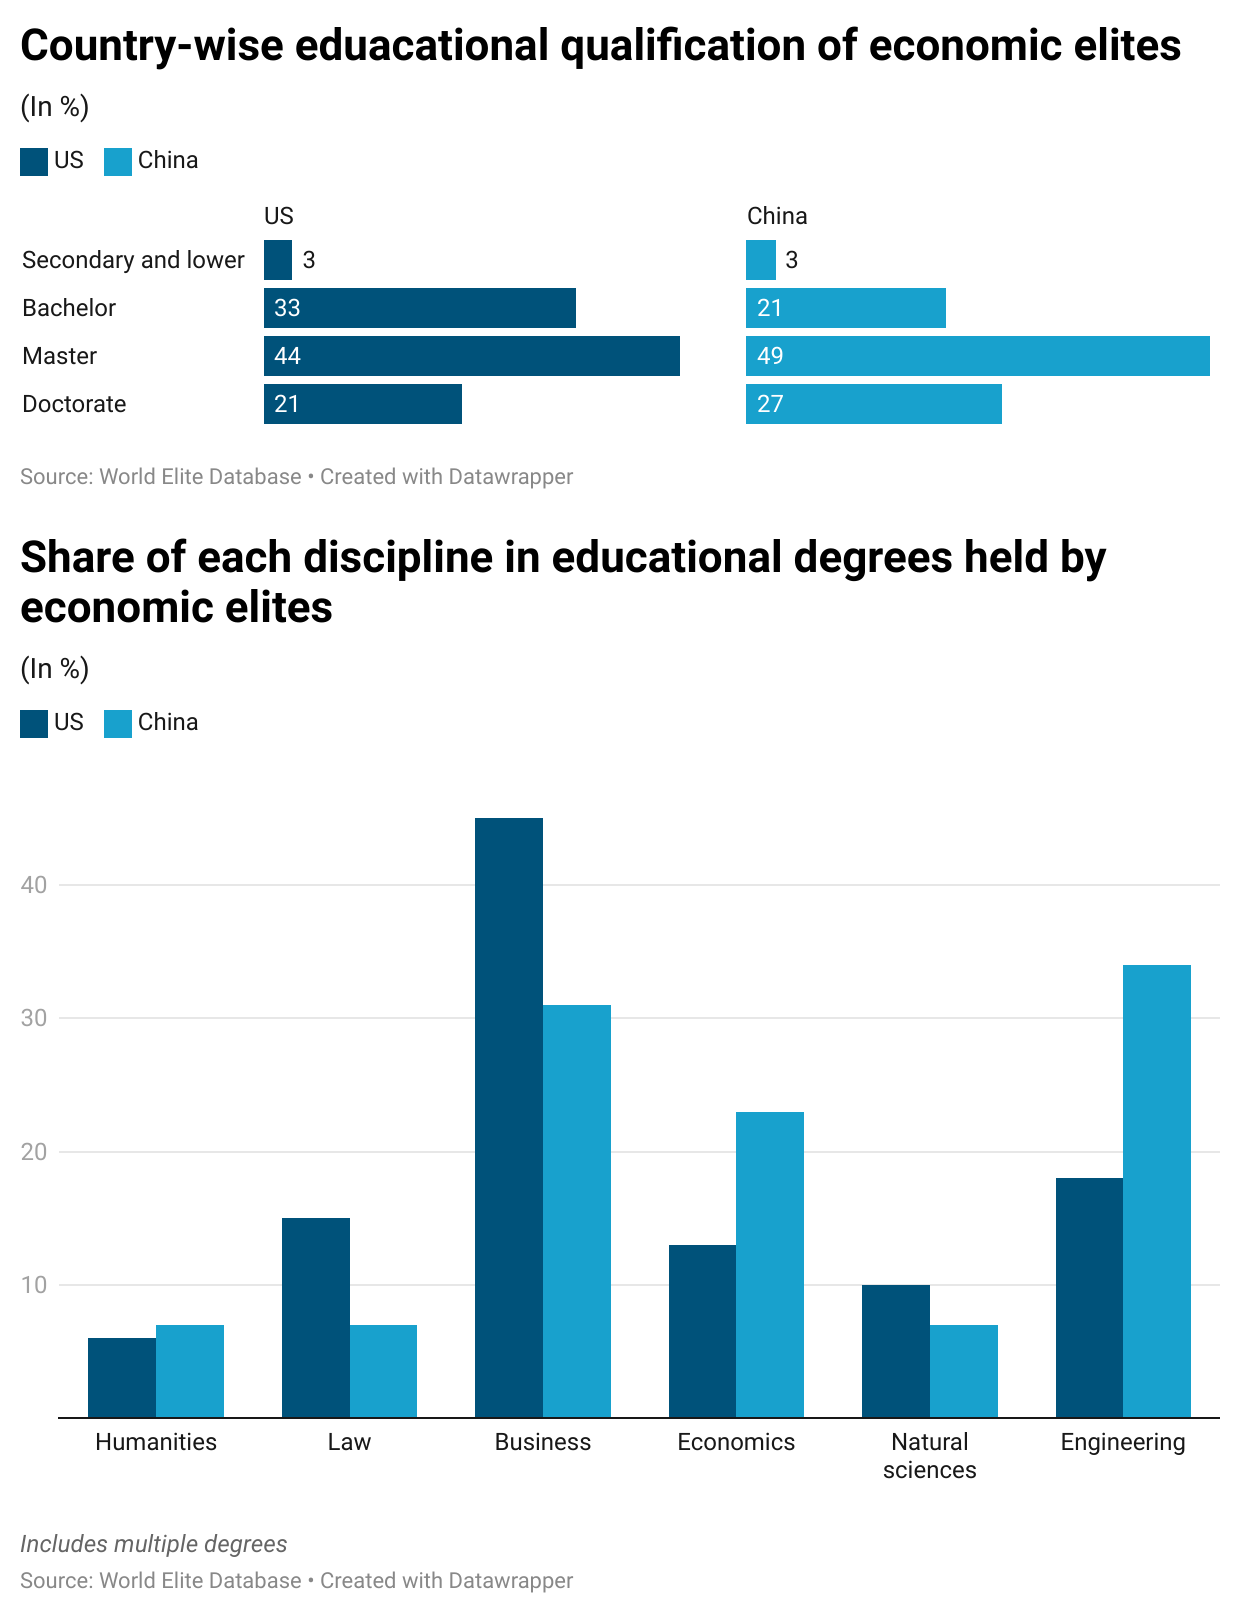
- …And better educated in technical disciplinesChinese elites are among the most highly educated, with 27% holding a doctorate. In comparison, 21% of US elites have the same qualification. The largest share in both countries holds a Master’s degree—around 49% in China and 44% in the US. Notably, Chinese elites are more likely to have a background in engineering, with 34% holding such degrees compared to 18% in the US. On the other hand, 45% of US elites have a degree in business, while this figure is 31% in China. Chinese elites are also significantly more likely to hold degrees in economics than their US counterparts.
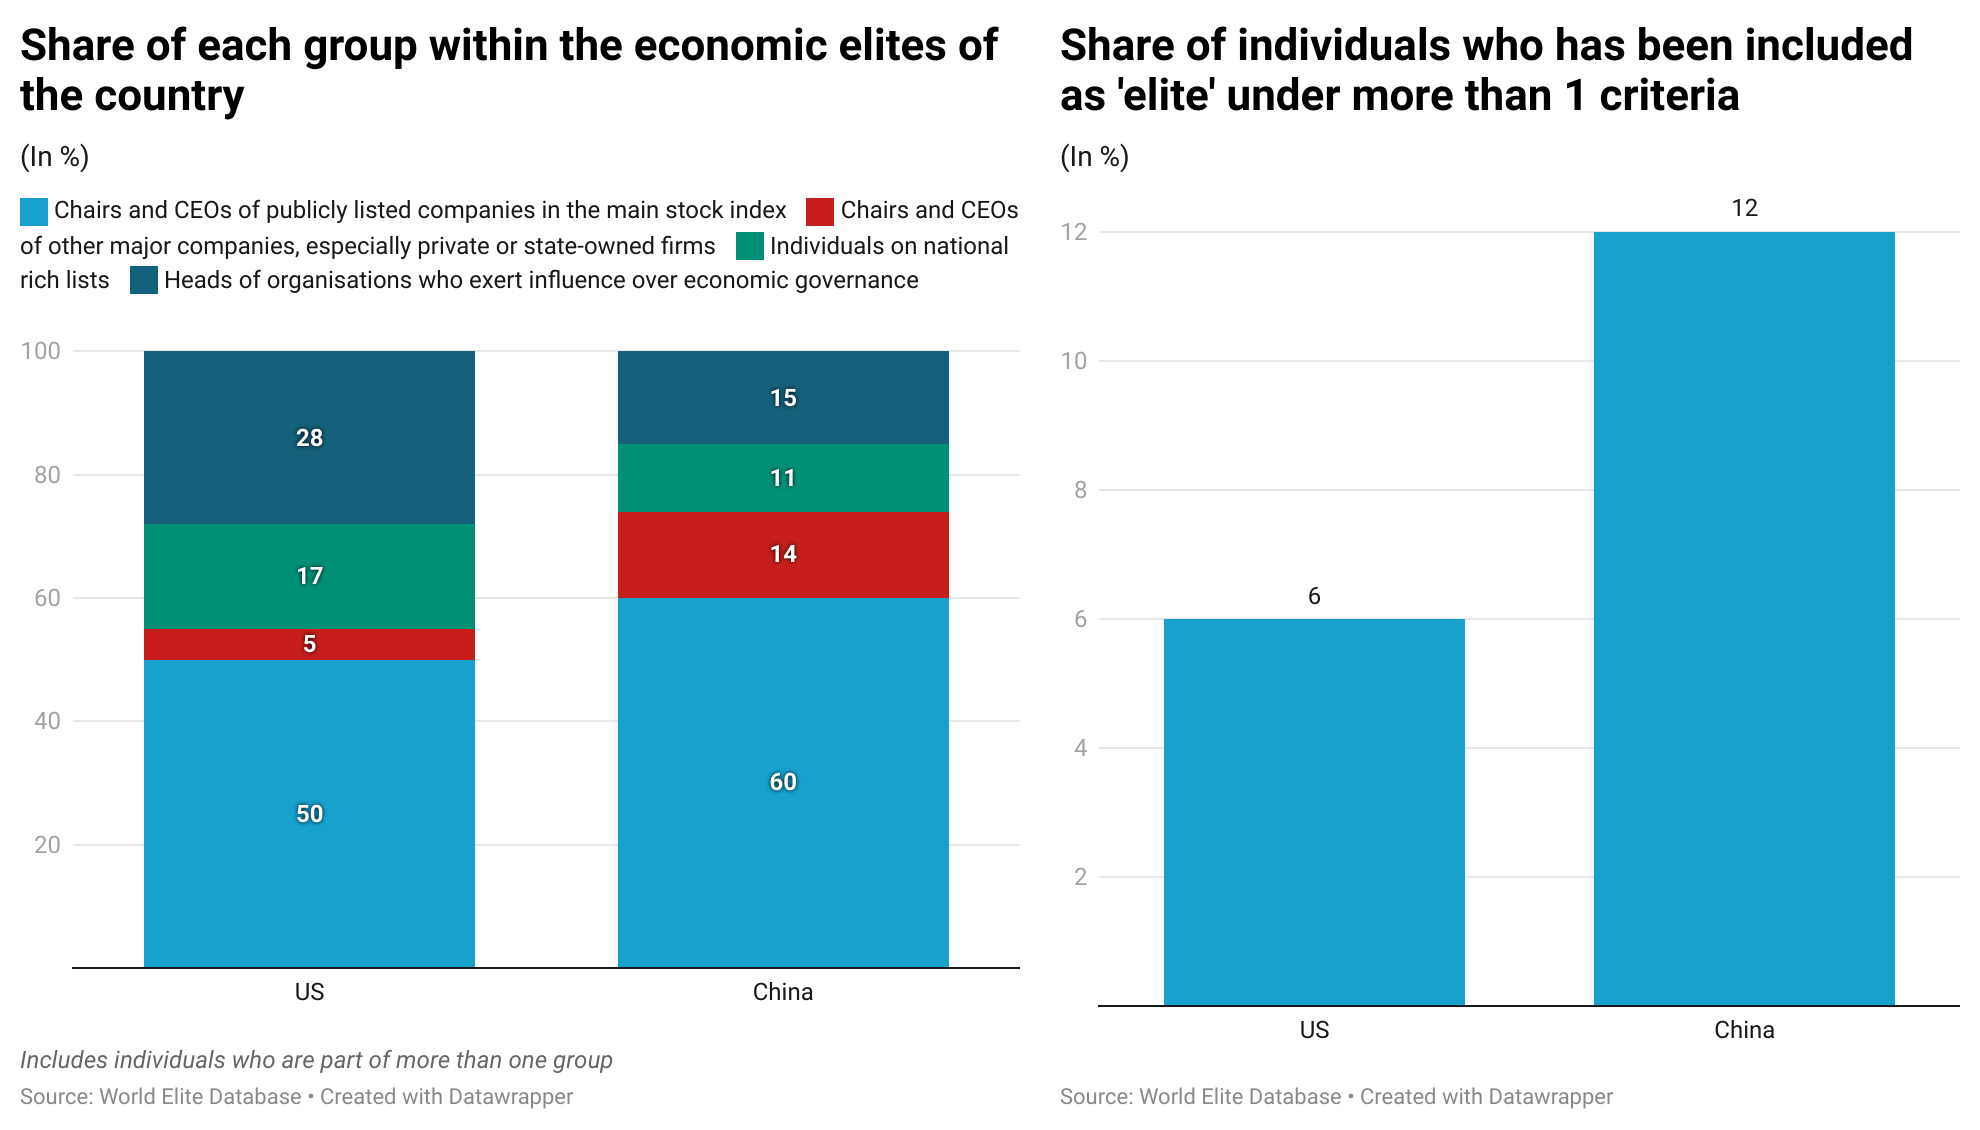
- Regulators are a bigger share of the elite in US than ChinaAn analysis of the individuals identified as part of the ‘elite’ by the WED shows that chairs and CEOs of large publicly listed companies (Category 1a) make up as much as half of the US elite and 60% of the Chinese elite. In the US, the second-largest group comprises heads of organisations that influence economic governance (Category 3), accounting for 28%. In China, this group represents 15%. Individuals who meet multiple criteria are rare across all countries. The share of regulators in total elites is the second highest in the US and lowest in China in the 16 countries which have been studied. For the third group, the US sample includes key figures across government, regulatory agencies, business associations, leading think tanks, foundations, major investors, unions, and public exchanges, as of end-2020. In China, it includes Central Committee members, senior economic ministers, bank governors, and heads of regulatory agencies, trade unions, and commercial organisations.