E-Paper



Number Theory: How has India done in ensuring social and economic justice?
.

 Prefer HTon Google


The winter session of Parliament ended with a big fight between the treasury and Opposition benches on the issue of their contribution to the legacy of BR Ambedkar, India’s biggest social emancipator and one of the key architects of the Constitution, and whether home minister Amit Shah spoke disrespectfully about him in his speech in the Rajya Sabha. On the penultimate day of the session, the fight took a completely different turn, with the BJP and the Congress accusing each other of assault inside the Parliament premises.
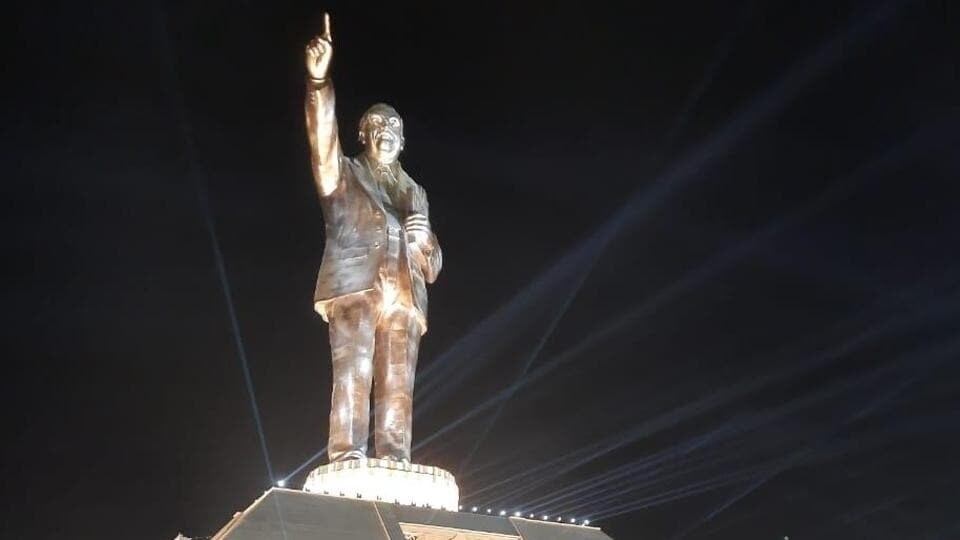
Beyond these polemics and accusations, there is a more important question to be asked. 75 years after the Constitution was adopted, how has India done on the most cherished goal of Ambedkar: ensuring social and economic equality along with the political equality that the constitution provided with the principle of universal franchise. Here are three charts which try and answer this question.
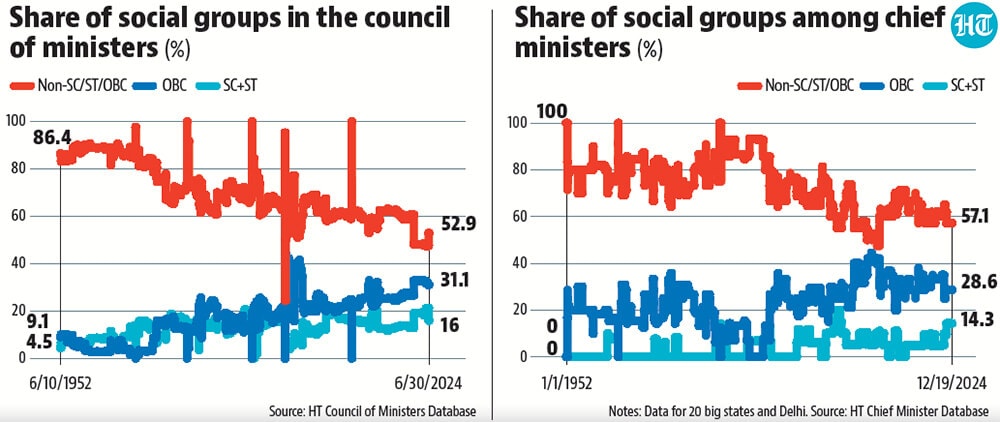
 India still does not have political equality in terms of equal social representation in the executiveAdoption of universal franchise did not automatically lead to political equality in terms of equal representation in the executive. 86.4% of the members of India’s first council of ministers were from caste groups which were not Scheduled Caste (SC), Scheduled Tribe (ST) or other backward classes (OBC). The skew was even bigger in terms of chief ministers of states. While representation has definitely improved over time, non-SC/ST/OBC persons, or the “upper castes”, still have the largest share in chief ministers and council of ministers in India. The social manifestation of political inequality is more acute for SC/ST population than OBCs, whose representation is closer to their estimated share in population, which varies between 40%-50% across various surveys.
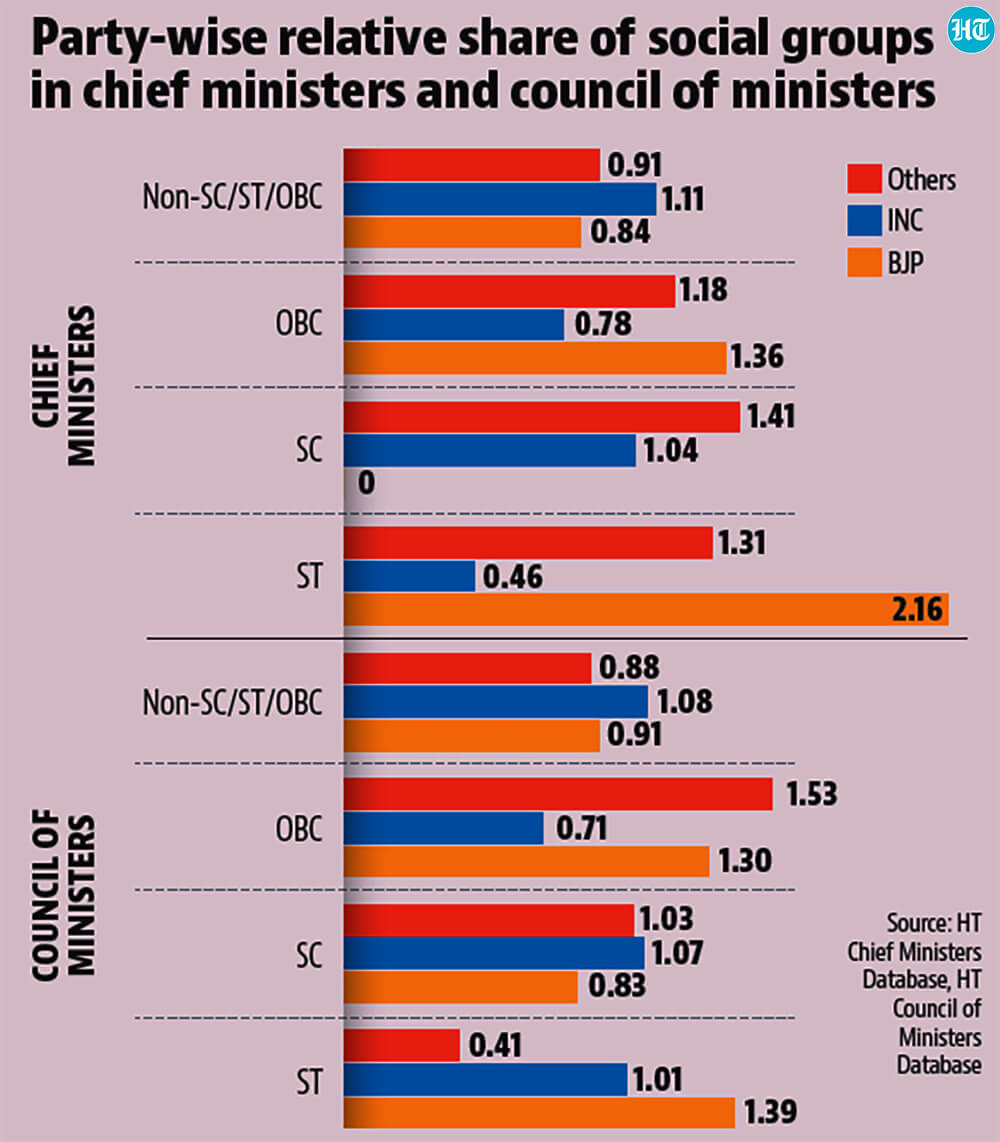
- Which party has facilitated social inclusion within India’s political executive?An easy way to answer this question is to look at the relative share of various social groups among chief ministers and council of ministers from three broad party groups: Congress, BJP, and others. The relative share of a social group is calculated by dividing its share in chief ministers and council of ministers of a particular party with their share in the chief ministers and council of ministers overall. A value higher than one would mean that a party has given greater representation to that social group. The Congress shows the highest relative share for non-SC/ST/OBCs in both the chief ministers and the council of ministers datasets. This number is the lowest for the BJP. As far as OBCs are concerned, the BJP has the highest relative share for chief ministers and second highest relative share among council of ministers while the Congress’s numbers are the lowest. However, the Congress is ahead of the BJP in relative share of SCs in both the chief minister and council of minister datasets. To be sure, some of the BJP’s advantage on this could be attributed to the fact that it started politics in an era when social equality was more widespread in politics than the period before it.
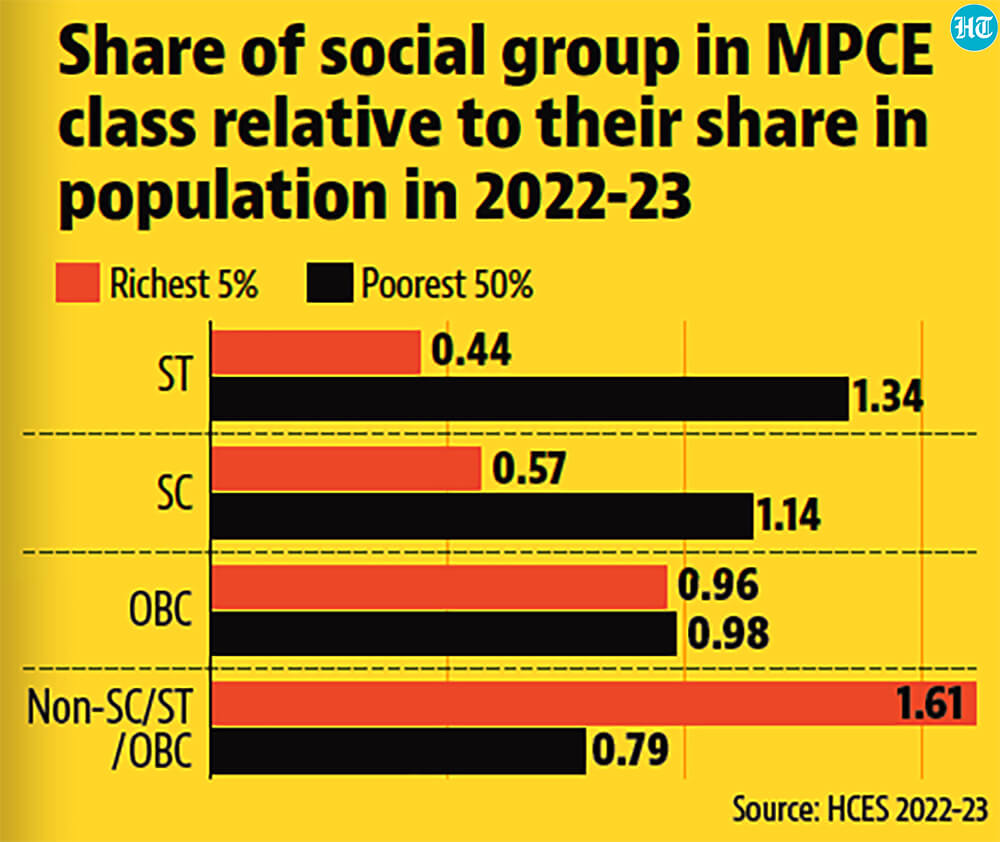
- And caste is still a key driver of economic inequalityA simple comparison of social group-wise relative shares in the poor and richest parts of the population brings it out clearly. SCs and STs are over-represented among the poorest 50% of the population by monthly per capita expenditure (MPCE) while non-SC/ST/OBC population is underrepresented here. The situation reverses itself when one is looking at the top 5% of the population. While OBCs seem to be proportionately represented in both these groups, there are likely large intragroup inequalities among them.
- But caste is not the only factorTo be sure, caste is not the only driver of economic inequality in India. While the trends above hold when looking at social groups at the country level or within states, they may not interstate. For example, the average MPCE of an SC person in Tamil Nadu is higher than that of the average upper caste person in Bihar. HT had pointed this out in an October 2023 story using the summary MPCE data collected in the Periodic Labour Force Survey (PLFS). The detailed household consumption survey data released earlier this year confirms it. This shows that there are nuanced routes to eradicating economic inequality which might be getting lost in the din that has been created by the political class.