
 E-Paper



August keeps the needle moving forward for monsoon | Number Theory
El Niño may hurt India’s monsoon, making August crucial. IMD data shows rainfall is reducing deficits in many states, but the rain is not ideal everywhere
Published on: Aug 8, 2026, 07:02:22 IST

 Prefer HTon Google
Share via


Copy link

An El Nino that is currently underway is expected to crimp India’s June-September monsoon, which accounts for 75% of the country’s annual rain. This makes rainfall trends very important in August, which is the second rainiest month of the year after July and accounts for 30% of monsoon rain. HT’s analysis of the gridded rainfall data of the India Meteorological Department (IMD) shows that August rain has not disappointed in filling up country-level rain deficit and decreasing seeing deficit rain in many states. However, not all of the rainfall has been ideal. Here is why.
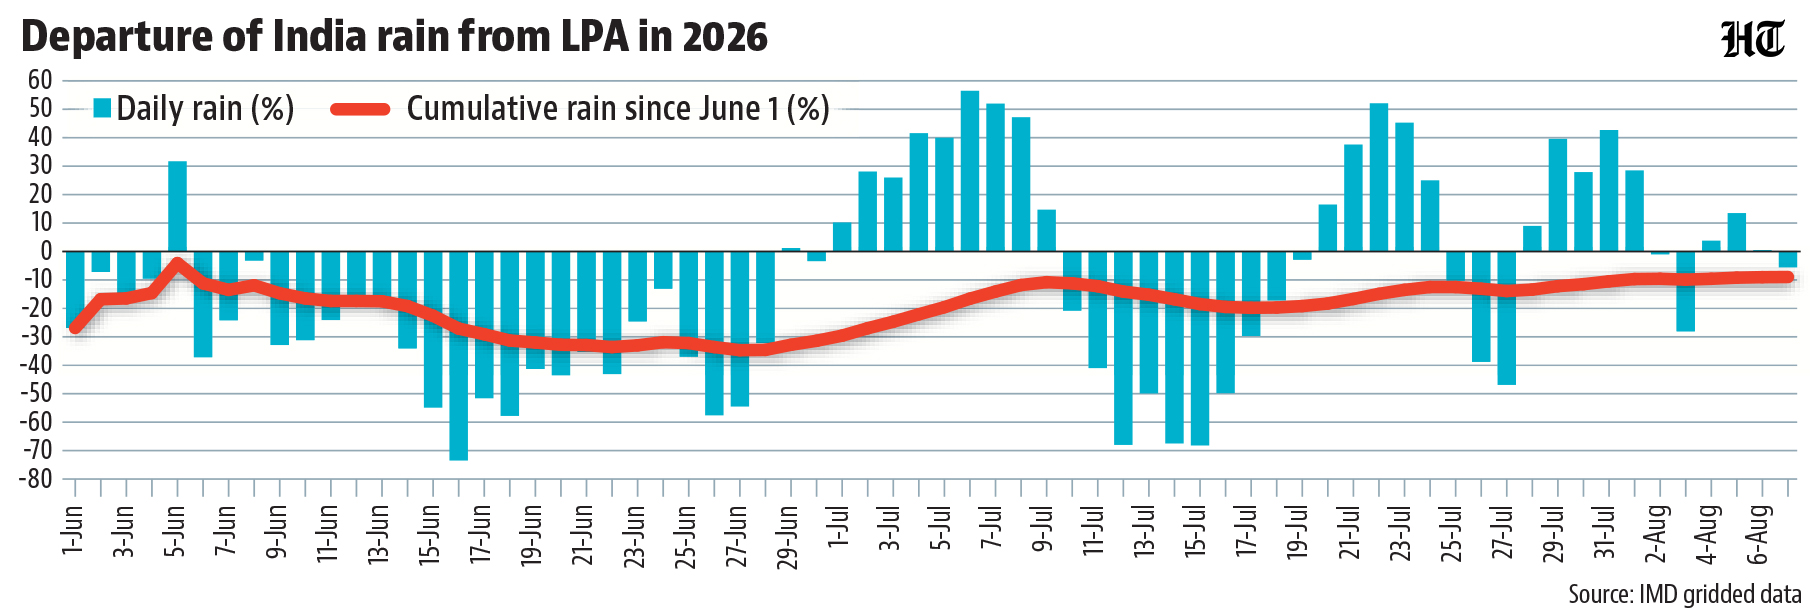
 This is an average first week of August, but it has decreased monsoon deficit to its lowest level since June 5According to IMD’s gridded data, India has received 63.1 mm rain in the first week of August. This is 61st highest or 66th lowest rain since 1901, the first year for which IMD has published gridded data, making this an average August so far. As expected, rain’s departure from the 1971-2020 average, which IMD currently considers as the Long Period Average (LPA) for tracking rain’s performance, is also modest so far: 1.6%. To be sure, any surplus is welcome this monsoon season, which was reeling with a 31% deficit compared to the LPA at the end of June. The August surplus, for example, has now brought the cumulative deficit down to 9%, the lowest it has been since June 5, when the season had just started.
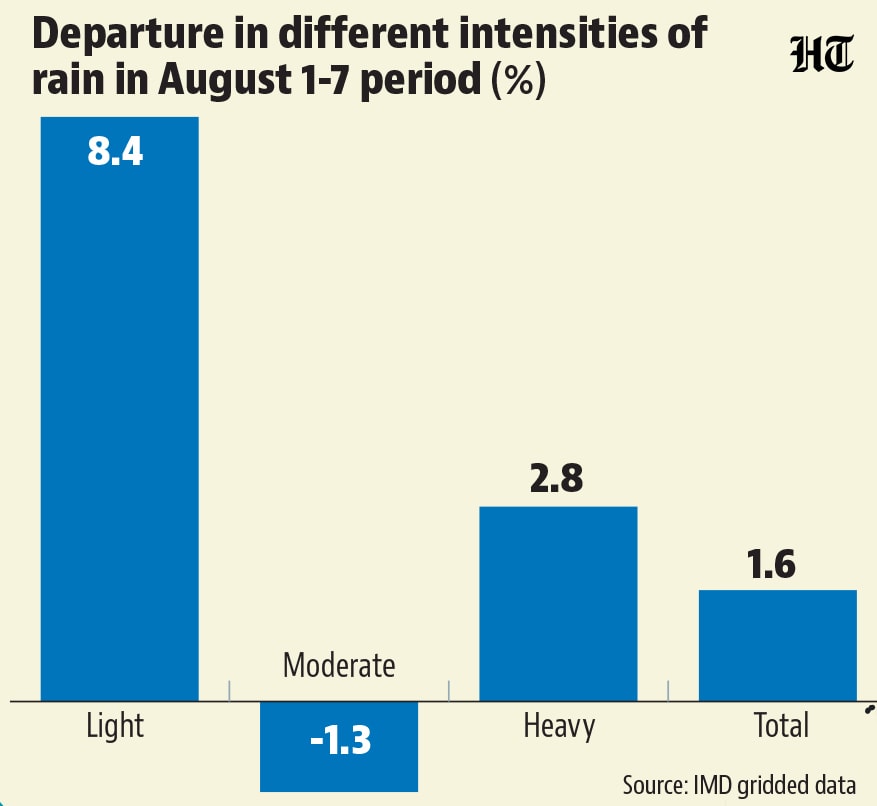
- The surplus this week also came without a big surplus in intense rainAccording to IMD’s gridded data, India has received 63.1 mm rain in the first week of August. This is 61st highest or 66th lowest rain since 1901, the first year for which IMD has published gridded data, making this an average August so far. As expected, rain’s departure from the 1971-2020 average, which IMD currently considers as the Long Period Average (LPA) for tracking rain’s performance, is also modest so far: 1.6%. To be sure, any surplus is welcome this monsoon season, which was reeling with a 31% deficit compared to the LPA at the end of June. The August surplus, for example, has now brought the cumulative deficit down to 9%, the lowest it has been since June 5, when the season had just started.
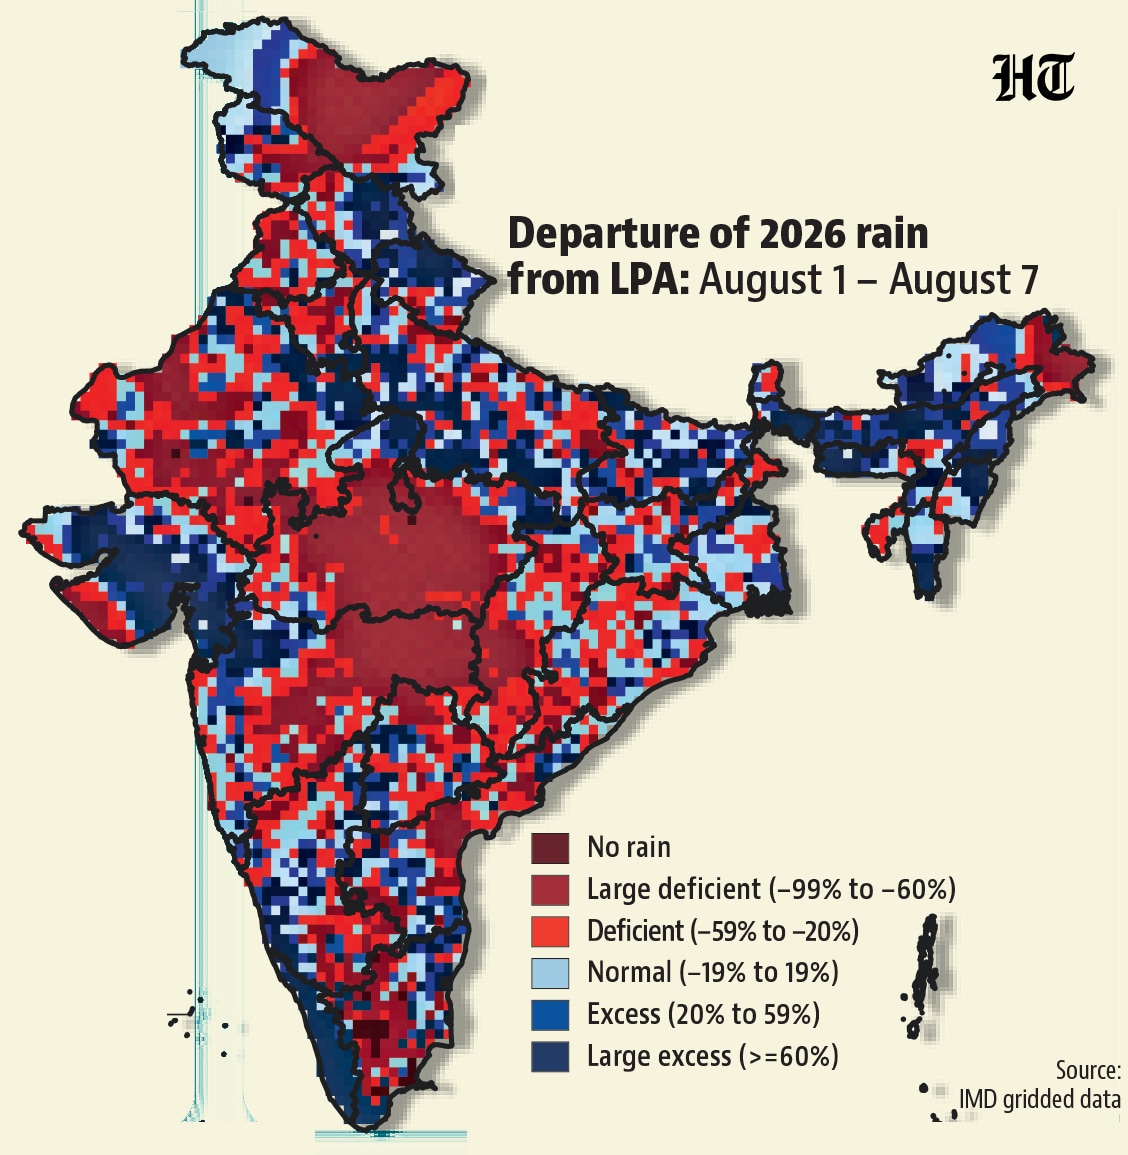
- The geographical distribution of rain was not always idealTo be sure, India’s heavy rain total can look usual irrespective of whether it falls in Goa (a place used to such rain) or Gurugram (a place not used to such rain). Some of the heavy rain this month has indeed fallen over Gurugram. This is also reflected in the skew in the geographical distribution of rain. IMD describes a surplus of 60% or more as “large excess” and that between 20% and 60% as “excess”. Deficits of similar levels are described as “large deficient” and “deficient”, with rain within 20% of LPA called “normal”. 49% of the country is either deficient or large deficient in rain this month and 32% has got either excess or large excess of rain. Clearly, the average-looking surplus this month has been distributed unevenly geographically.
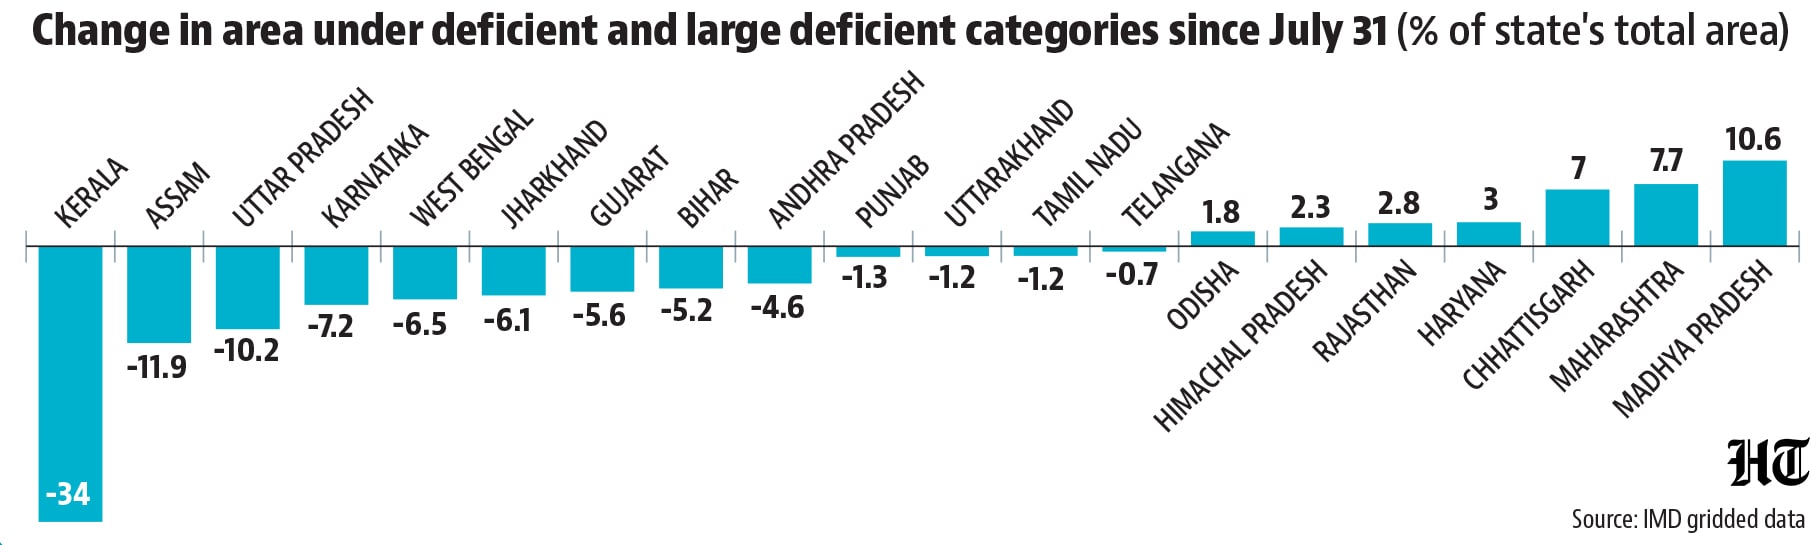
- But the places with surplus were often places running deficit before AugustSome states might welcome the geographical skew in August rain somewhat. Of the 33 states and UTs for which this calculation is possible using the gridded data, 19 saw the area under deficient and large deficient categories decrease this week compared to the cumulative status on July 31 and another four saw no change, with only 10 seeing a growth in such area. Even among these 10, only six have seen the area under the two categories grow to more than one third of the state’s area. Rajasthan, Haryana, and Madhya Pradesh are the only big states among these six states. This means that big surplus in August often happened in places that needed it. That helped with rain accumulation, but has also led to disasters.


Get the latest India News, breaking headlines, and real-time updates from across the nation. Stay informed on politics, government policies, crime, weather, and CEC Gyanesh Kumar row Live.


