
 E-Paper



Could virus have silently infected far more than reported, asks study
The projection by researchers underscores how Covid-19 multiplies silently among populations, complicating efforts to cut off its spread especially at a time when authorities need a clear picture to be able to relax lockdowns.

 Prefer HTon Google


Scientists are increasingly turning to daily death data to estimate the size of the Covid-19 outbreak around the world, with one such model showing India possibly saddled with a far higher number of infections than reported.
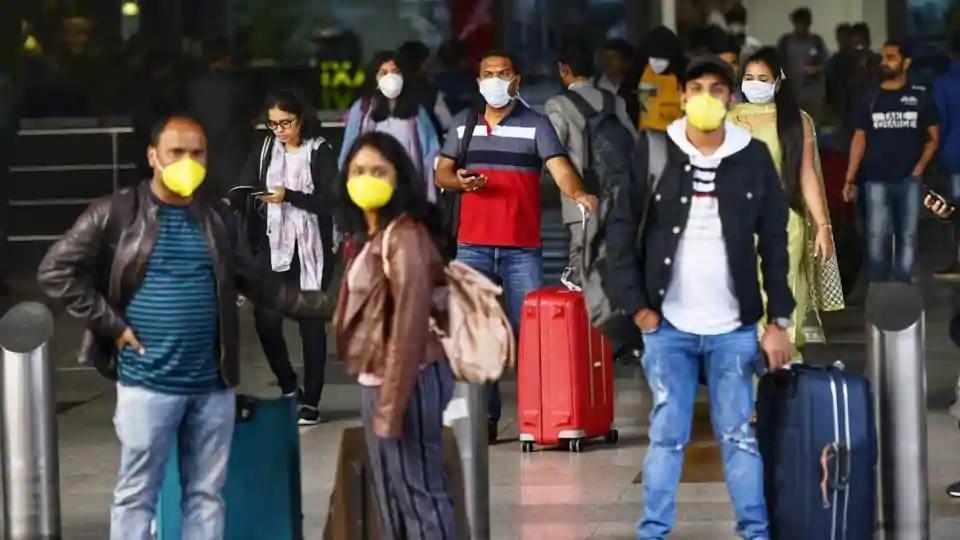
The projection, by researchers from the Imperial College London, underscores how the disease multiplies silently among populations, complicating efforts to cut off its spread especially at a time when authorities need a clear picture to be able to relax lockdowns.
In the seven days starting March 22, the country is estimated to have had 16,800-23,600 true infections as opposed to the 2,395 that were reported, according to the short-term forecast. According to the researchers, the projections were based on the number of deaths and predicted that fatalities in the week ending on April 11 would likely be somewhere between 119 and 567. By last Saturday, the actual number of deaths reported was 288.
As of Wednesday, India’s death toll stood at 423 and the total number of cases at 12,330.
“We use the reported number of deaths due to Covid-19 to make these short-term forecasts as these are likely more reliable and stable over time than reported cases,” said the authors, including the team that came up with a crucial report on March 16 estimating the trajectory of the pandemic in a now-famous effort that is seen to have compelled the United Kingdom government to take strict measures.
The need to use the fatalities parameter and work backwards is based on the assumption that Covid-19 deaths are more likely to be reported than cases, which may be missed for several reasons. “One of the issues is that cases with Covid-19 can present with a range of symptoms -- some of them for example are too mild to be reported, and hence cannot be tested,” said Sangeeta Bhatia, the lead researcher on the project, in an email interview to HT.
“Another factor that contributes to the variability in reporting is the limited testing capacity in each country. Related to this limitation is the decision about whom to test. In the early stages of the outbreak, India, like many other countries, was testing only travellers from affected regions or contacts of travellers,” she added.
This is particular worrying for India, where the strategy to contain cases hinges on putting in force a hard lockdown in hot spot areas, and opening some of the others up to stave off further economic devastation. On March 25, India was put under the world’s biggest lockdown that will now last till at least May 3, with some relaxations planned after April 20 in areas deemed relatively safe.
The premise for the projections rests on ascertaining the true number of cases first by looking at the number of deaths in the previous two weeks and the number of reported cases in the 10 days prior to that period.
“If we assume that all deaths due to Covid-19 are reported, then very roughly we can look at the expected number of fatalities based on the case fatality ratio, to estimate the number of underlying cases that would result in the observed number of deaths,” Bhatia said.
The ratio between reported and underlying cases can then be used to predict the number of deaths in the following week. Using these trends, the report pegged India’s disease transmission rate – the average number of people infected further by one patient – at 3.11.
This means that a Covid-19 patient on average was infecting three more people before the country was put under a nationwide lockdown. The number is closer to the worst-case scenario transmission rate of 4 identified by the Indian Council of Medical Research in modelling done in February. The best-case scenario, ICMR scientists told HT last week, was 1.5.
For a disease to stop spreading, the transmission rate needs to reduce to less than 1.
Fatality data has been similarly used by public health experts in the United States to estimate the trajectory of the Covid-19 epidemic and predict demand for hospital resources. A model by University of Washington’s Institute for Health Metrics and Evaluation uses daily death data to calculate hospitalisation-to-death ratios, “which then inform the model parameters used for predicting hospital bed need”.


