
 E-Paper



Farm fires gone, weather now polluting Delhi’s air?
The recent spike in Delhi's air pollution comes despite a fall in the contribution of pollutants from stubble burning and underlines the importance of climatic conditions in pollution levels, not just in Delhi but entire north India.

 Prefer HTon Google


The Union government told the Supreme Court on Friday that it is constituting an enforcement task force and 17 flying squads to implement pollution control measures through surprise checks, inspection and closure of polluting units. On Thursday, the top court observed that it could set up a task force itself since “nothing is really happening to control pollution”.
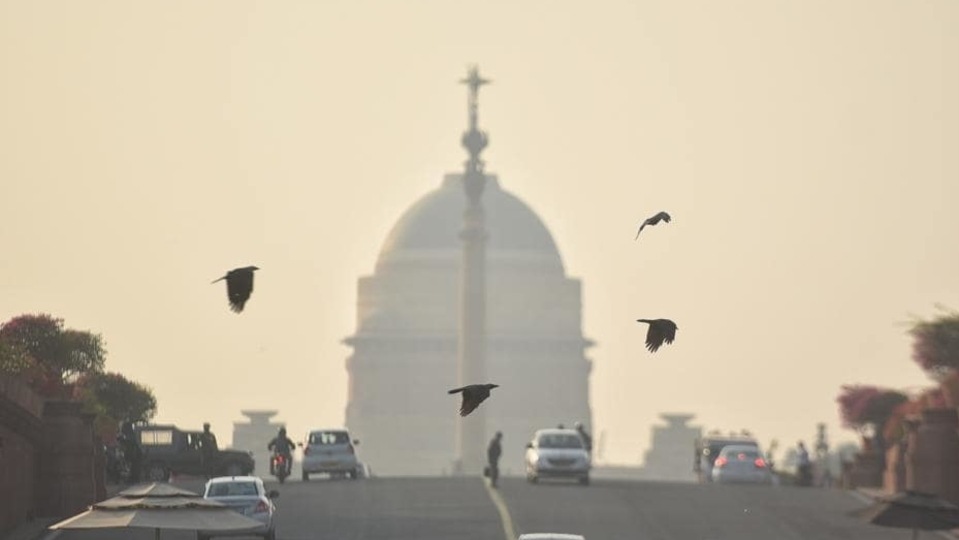
The court is not wrong about the pollution problem. Delhi’s Air Quality Index (AQI) has been in the “severe” category in four out of the last seven days ending December 2, according to 24-hour bulletins issued by the Central Pollution Control Board at 4pm. PM2.5 concentration level – it is the most harmful pollutant – has been above the “severe” benchmark for five of seven days ending December 1. Even the light rain on December 2, did little to bring down pollution levels with AQI remaining in the “very poor” category (346) according to the 24-hour average at 4pm on December 3.
The recent spike in pollution comes despite a fall in the contribution of pollutants from stubble burning. According to data from VIIRS instrument aboard the Suomi-NPP satellite, the number of farm fires fell every week after the second week of November. The spike in pollution, even though farm fires have fallen, underlines the importance of climatic conditions in pollution levels in not just in Delhi but entire north India. This also highlights the need for a holistic pollution policy instead of ad-hoc measures. Here are four charts which explain this argument in detail.
Latest spike in Delhi pollution despite decline in farm fires
The daily average of PM2.5 levels in Delhi was very high in the first week of November. The situation improved over the month, only to worsen again towards the end. A weekly classification of days by PM 2.5 levels shows this clearly. There were nine ‘severe’ days in the first half of November. This came down to just one day in the third week, but increased to four again in the last eight days of the month.
Data from the SAFAR database shows that the farm fires had a very different role to play in the spike in overall pollution levels in the beginning and end of November. Stubble burning contributed to 8% of the PM2.5 concentration in the period between October 30 and November 3. This increased to 30% between November 9 and 13. The average contribution of stubble burning to PM2.5 levels was 4% in the last week of November. This data corroborates a satellite-based count of number of farm fires in the adjoining states.
To be sure, there need not be a one-to-one correspondence between farm fires and their polluting impact on Delhi, as was explained by HT on November 16.
What explains the recent spike in pollution?
Probably it’s the weather. There has been very little rain, low wind speed and day time temperatures have been lower than average.
Low rains in November didn’t help
One reason why October air in Delhi and large parts of north India was cleaner than usual was the very high rainfall washing away the pollutants in air in the literal sense. The tables have turned in November, with most north-Indian states experiencing lower than normal rainfall in November. Punjab, Haryana, Delhi, Uttar Pradesh, and Bihar – all received rainfall 150% or more above the long period average or LPA (the average of rainfall in 1961-2010 period) for October. This was among the top 10 years of highest October rainfall since 1901 in all these states except Haryana, where it was the 18th highest. This helped these states in October, as rainfall washes away the pollutants. This advantage vanished in November. None of these states received even half a millimetre of rainfall when the LPA for November ranges from 3.6 mm in Haryana to 6.2 mm in Bihar.
Neither did low day-time temperatures
Higher day-time temperatures can prevent accumulation of pollutants close to the ground during the day when vehicular and industrial pollutants are more likely to be added to the air. While November in itself is colder than October, this year the day-time temperatures in November also deviated further below normal. Average maximum temperature for November in Delhi was 6.1% below the 1981-2010 average in the month of November.
The statistics described above show clearly how Delhi’s pollution levels remain at the mercy of meteorological factors. The December 2 air quality forecast on the SAFAR website speaks for itself, “The AQI today (December 2) indicates ‘very poor’ air quality. For the next three days, winds are likely to be calm reducing ventilation leading to deterioration of air quality but within the same category. From 6th Dec onwards winds are expected to increase dispersing pollutants but AQI likely to remain in ‘very poor’ category. Partly cloudy sky and low mixing layer height are preventing efficient dispersion of pollutants”, the forecast says.



