
 E-Paper



Number Theory: Caste disparities in the Indian labour market
While good jobs can improve economic well-being through higher earning, business ownership can induce gain in economic power

 Prefer HTon Google


Good jobs and business ownership can be two crucial vehicles for upward economic mobility. While good jobs can improve economic well-being through higher earning, business ownership can induce gain in economic power through ownership of assets and means of production. Both are important routes of economic upliftment for marginalised caste groups in India, majority of whom have been historically landless and asset-poor. Caste-based occupational and industrial segregation and representation of different caste groups in enterprise ownership are among the issues that have been analysed in this year’s State of Working India Report, published by the Azim Premji University. Here are four graphs that explain some of the results.
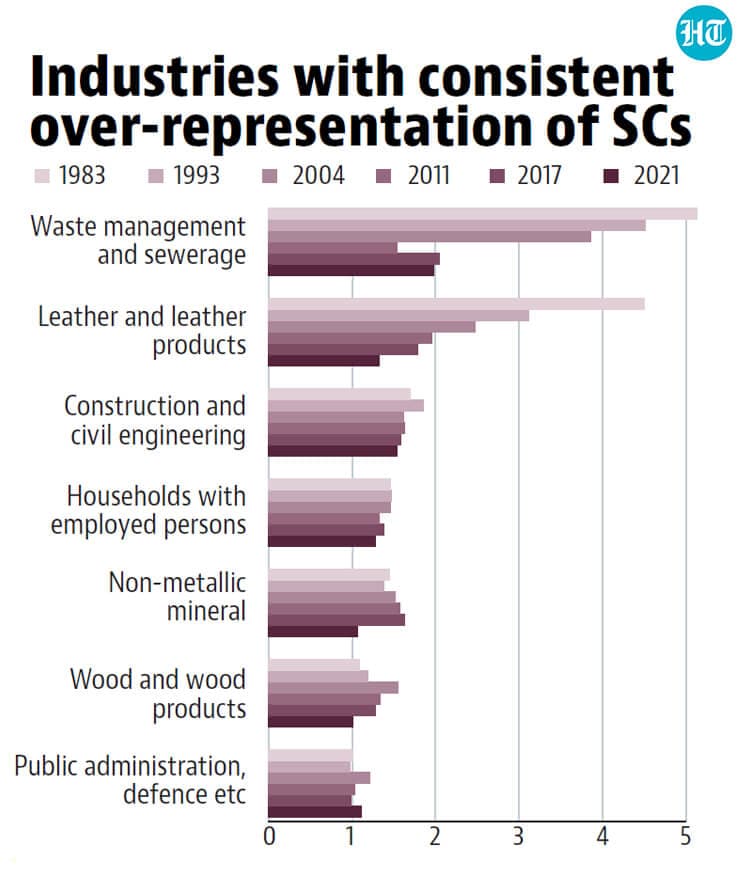
 Who works in which industry?Data from the Employment Unemployment Surveys for 1983, 1993-94, 2004-05, 2011-12 and Periodic Labour Force Surveys for 2017-18 and 2021-22 show that in a number of industries the Scheduled Caste (SC) community has remained consistently over-represented in proportion to their workforce shares since 1983. Most prominent among these industries are waste management and sewerage and the manufacture of leather and leather products -- the two industries that have strong historical ties with their caste identities. However, in both these industries, the over-representation of SCs has substantially declined, suggesting some progressive transition of caste-based segregation in Indian industries. The share of the SC community in the leather industry has consistently declined from 4.6 times their workforce share in 1983 to 1.4 times in 2021-22. In the case of waste management and sewerage, the decline, although substantial, was less consistent. Over-representation of SCs in this industry decreased steadily from over 5 times their workforce share in 1983 to 1.6 times in 2011-12, with the largest drop occurring during the high growth period between 2004-05 and 2011-12. However, by 2017-18 their share in this industry increased to 2.1 times and has remained above twice their workforce share even in 2021-22. Interestingly, despite these positive changes, the overall level of caste-based segregation in Indian industries has not changed much. For an overall level of segregation, we use the widely used Duncan Index of Segregation which measures what proportion of workers from any two groups in the workforce must be moved between industries for their industrial distribution to be similar. This Index of Segregation between SC and non-SC-ST-OBC workers, shows that 28% of the workforce from these two groups needed to be reallocated between industries to achieve a state of no segregation in 2021-22. This value was 29% in 2004-05.
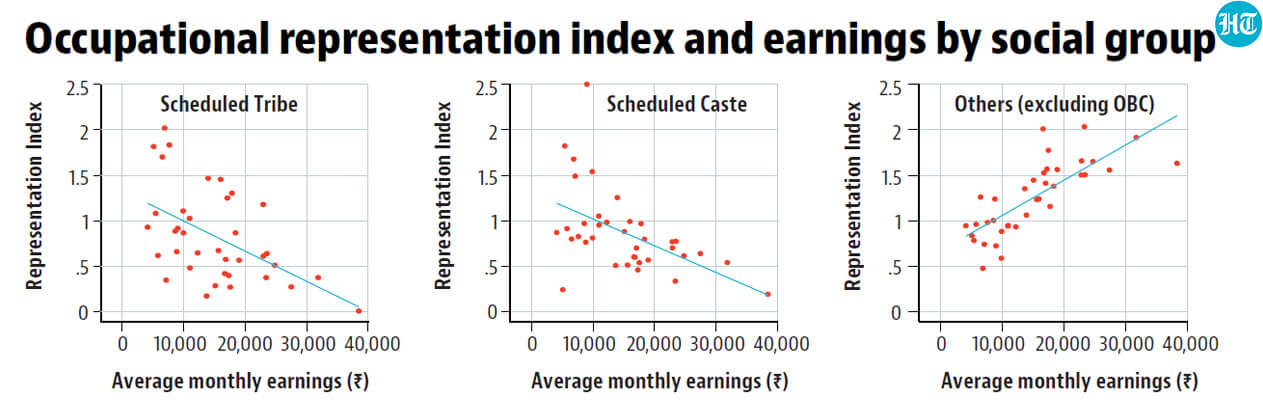
- Who does what kind of work?Within and across industries, there exist various occupational hierarchies. The Duncan Index for occupational categories estimated using 2021-22 PLFS data shows that caste-based occupational segregation is even more pronounced than industrial segregation. Between SCs and non-SC-ST-OBC, 32 % of the workforce in 2021-22 needed to be reallocated between occupations to achieve a state of no segregation. Between STs and non-SC-ST-OBC, the corresponding number was 34% . Using average monthly earnings data for various occupations from PLFS, we find a clear negative relationship between occupational representation and earnings for SC and ST workers. They are over-represented in low-earning occupations and under-represented in high-earnings ones. SCs are most over-represented in low-earnings occupation categories -- refuse workers and other elementary workers; cleaners and helpers; and street vendors (excluding food). On the other hand, many of those from the scheduled tribes are in low-end jobs in mining, construction, manufacturing and transport; food preparation ; handicraft and printing ; and personal care. The occupational representation and earnings relationship is reversed for upper caste workers. They are not over-represented in any occupation with average monthly earnings less than ₹14000 (except in personal care and sales). They are also clearly over-represented in all occupations with earnings greater than ₹14000 including the highest earning occupations -- professionals in science and engineering ; business and administration; and information and communication technology .
- Who owns enterprises?Caste-based disparities are also observed in ownership of enterprises. Constructing a representation Index for ownership of private proprietary enterprises from the latest available Economic Census data (6th round, 2013) we find that even in the smallest enterprises, SC and ST owners are under-represented compared to their share in the overall workforce. But more strikingly, the Representation Index decreases steadily as enterprise size increases. As a result, SC and ST owners are barely represented in larger enterprises employing more than 20 workers. Conversely, upper caste over-representation increases with firm size. Those from other backward classes (OBCs) are found between the two extremes. Unfortunately, this analysis cannot be extended to more recent years since the 2019 Economic Census data has not yet been released.
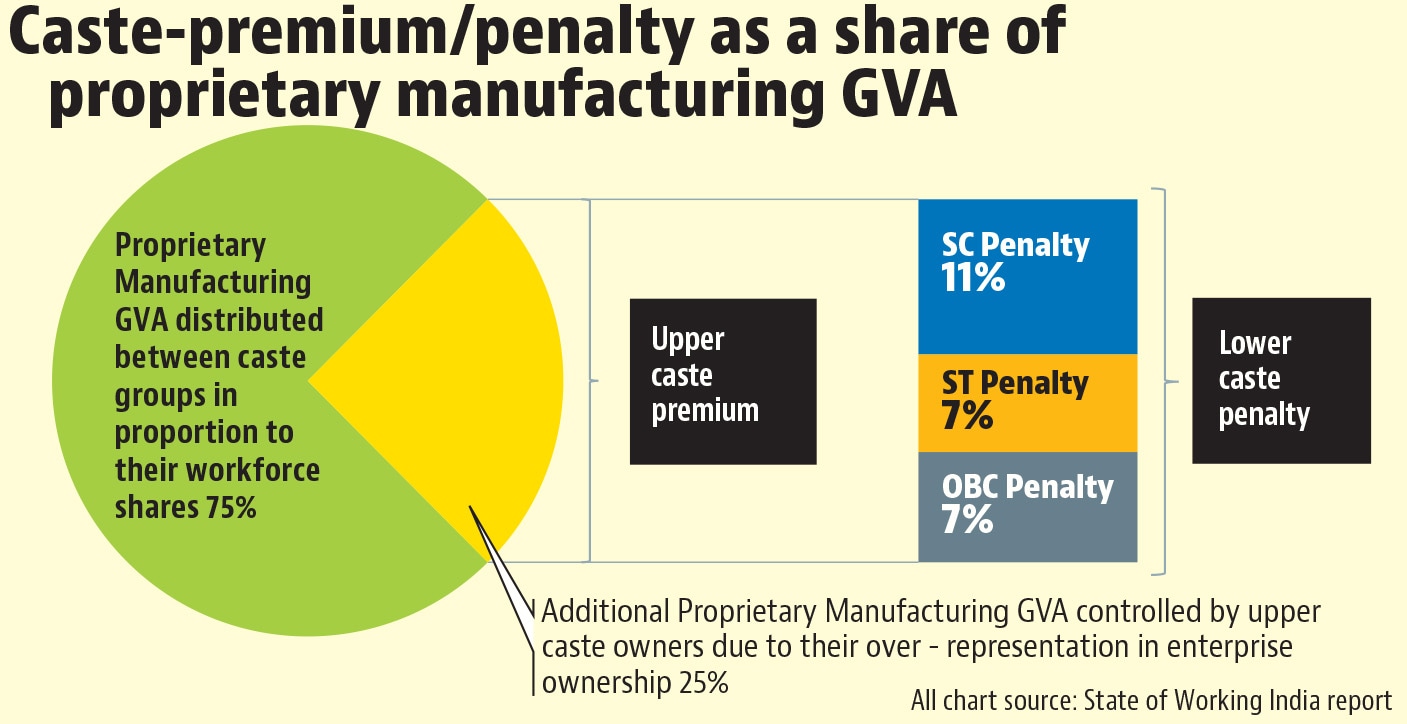
- Caste-penalties in enterprise ownershipOne way to estimate the economic cost of social inequality in enterprise ownership is to compare the actual gross value added (GVA) controlled by each social group with what would have been the case if there were no social inequality in enterprise ownership. We estimate a difference of ₹42000 crore (in 2013 prices) between the actual and ideal GVA commanded by SC-ST-OBC firms (in proprietary ownership) with SCs facing the biggest gap. To put this number in context, ₹42000 crore was 25% of the total GVA in private proprietary manufacturing sector in India.

(Angarika Rakshit is a Research Fellow at the Centre for Sustainable Employment at Azim Premji University Bangalore. The content and opinions expressed are that of the author and do not necessarily reflect the views of the university.)


