E-Paper



Number Theory: How bipolar are the MP, Rajasthan and Chhattisgarh polls?
An HT analysis shows that the answer varies depending on which indicator one is looking at. Here are four charts which explain this in detail.
Published on: Oct 27, 2023, 11:43:59 IST

 Prefer HTon Google
Share via


Copy link

Three out of the five states going to polls in this election cycle, Rajasthan, Madhya Pradesh and Chhattisgarh, have always seen a BJP versus Congress contest. To be sure, these three are not the only states where the main electoral contest is between these two political parties. How bipolar are the elections in these three states?

How bipolar are the MP Rajasthan and Chhattisgarh polls?
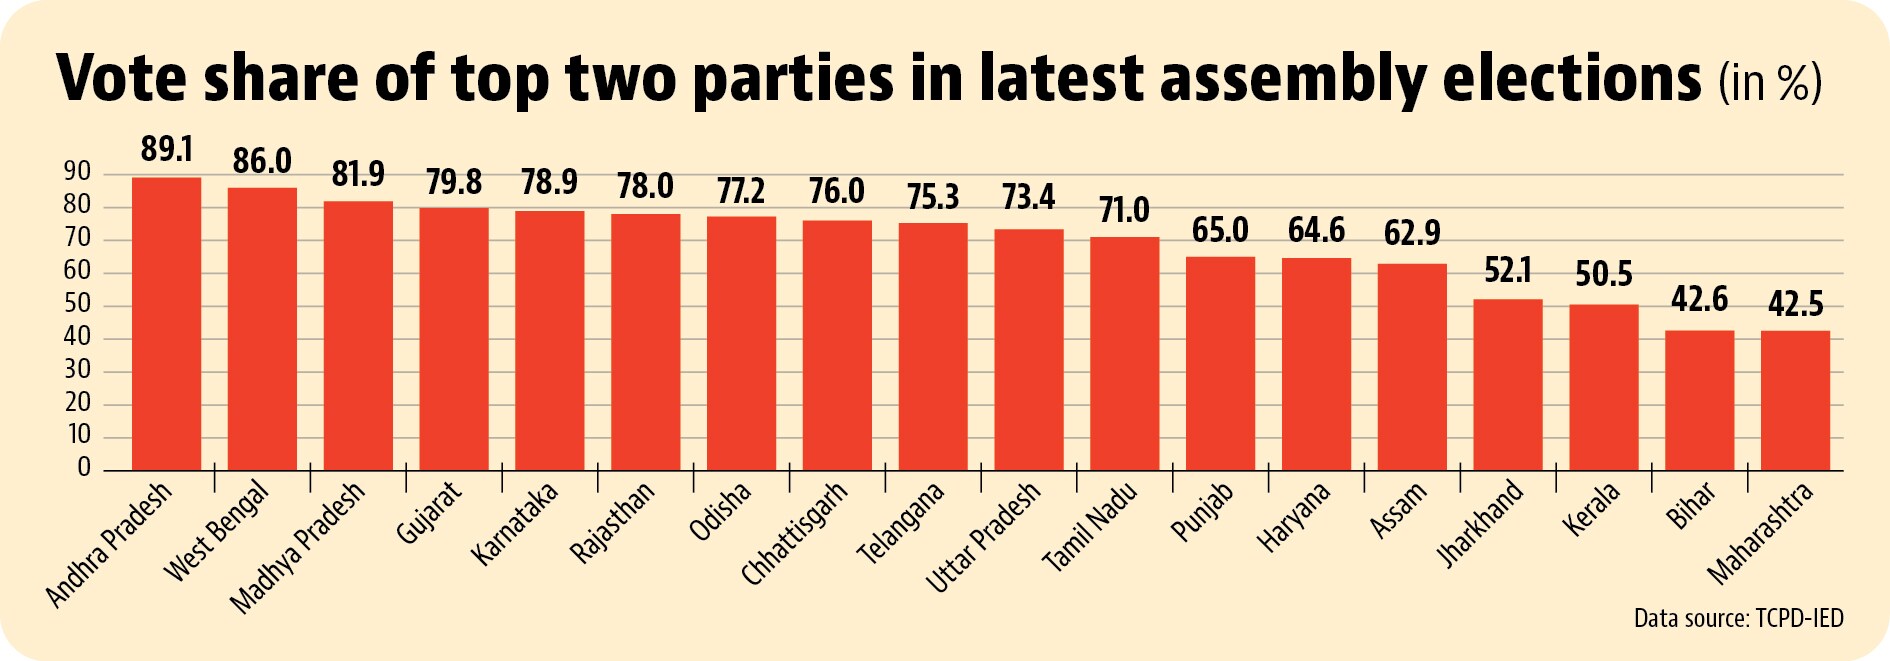
 Bipolarity in terms of the vote share of the top two partiesOne of the simplest ways to measure whether or not an election is bipolar is to look at the combined vote share of the top two parties in a state. An HT analysis of the latest assembly elections in states that have at least 10 Lok Sabha constituencies shows that Madhya Pradesh, Rajasthan and Chhattisgarh were ranked third, sixth and eighth out of 18 states when it came to the combined vote share of the top two parties in the state. The top two states in this list are Andhra Pradesh and West Bengal, while Bihar and Maharashtra are the bottom two states. Are the 2018 vote shares in keeping with past trends in the states of Rajasthan, Madhya Pradesh and Chhattisgarh? A comparison of the vote shares of the top two parties from 2003 onwards – the first elections after Chhattisgarh was carved out of Madhya Pradesh – shows that the combined vote share of the top two parties in 2018 was the highest in Madhya Pradesh, lowest in Chhattisgarh, and second highest in Rajasthan. To be sure, these rankings need to be read with a caveat that some states see an electoral contest between alliances rather than parties and therefore party-wise vote share numbers might be misleading as far as political polarization is concerned.
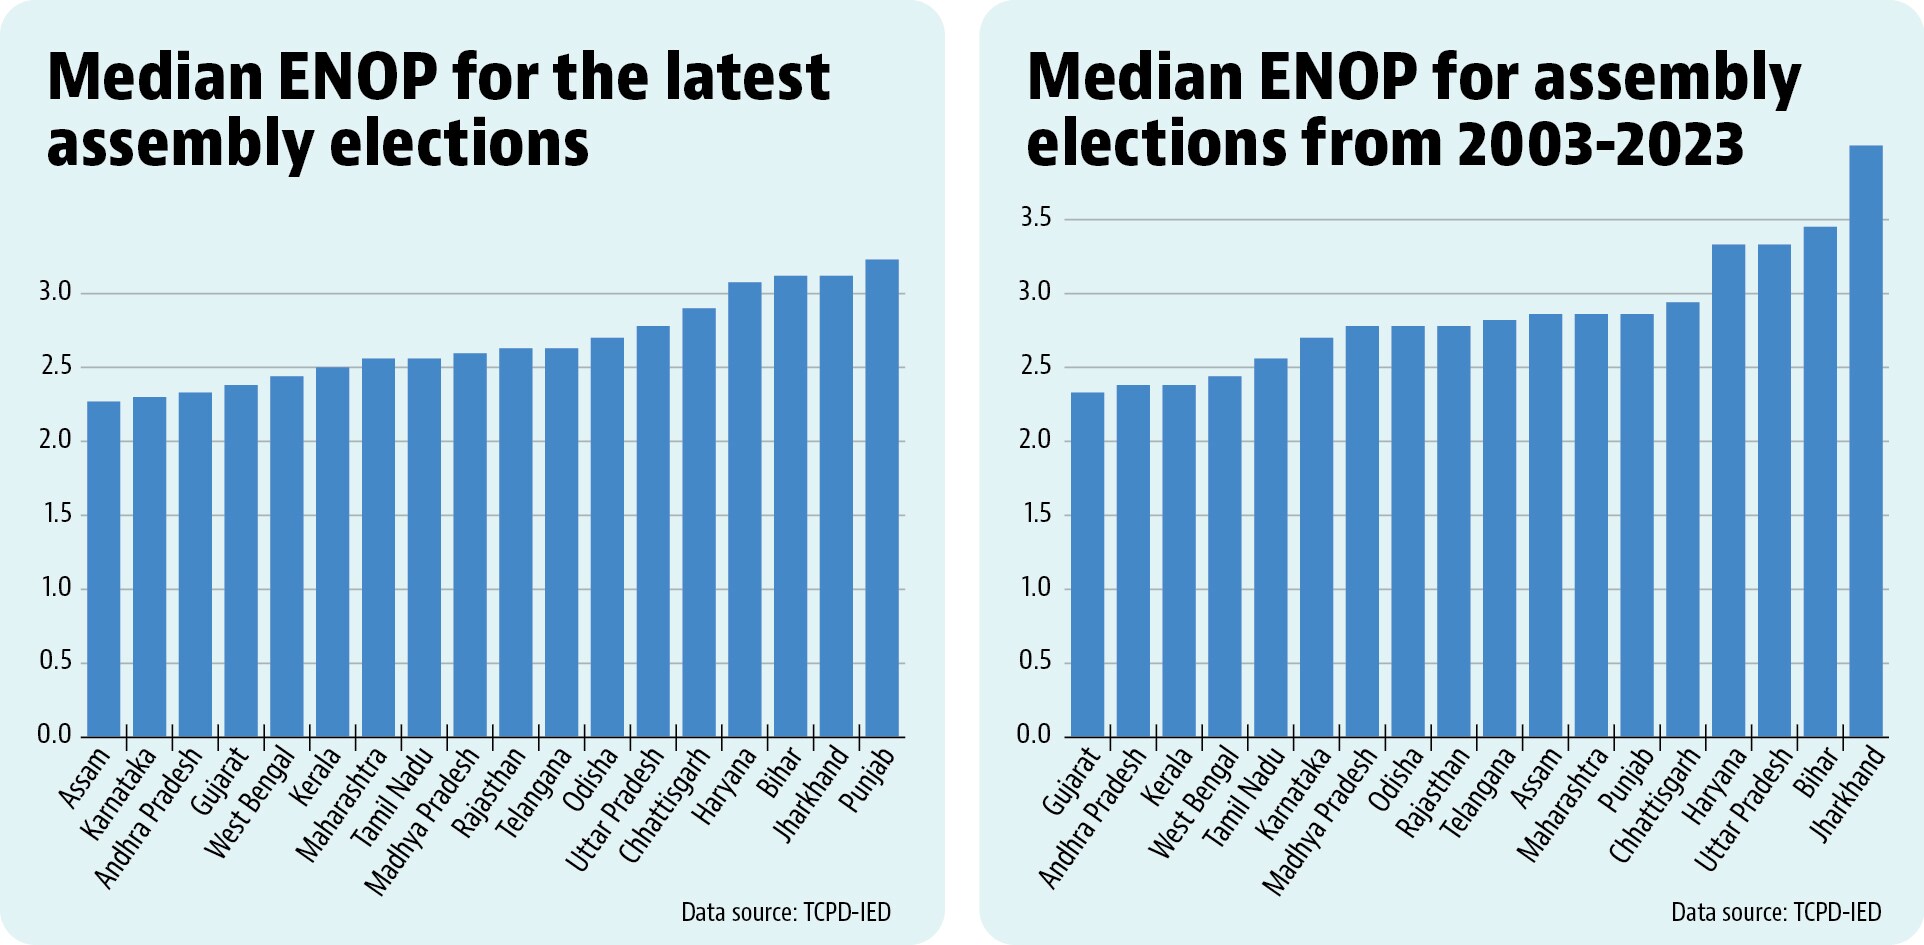
- Bipolarity in terms of contest at the constituency levelAggregate vote shares do not tell us anything about the nature of the contest at the constituency level. This is where looking at the Effective Number of Parties (ENOP) can help. ENOP is the reciprocal of the sum of squares of the vote share of every candidate in a constituency. This means that if there are 10 candidates with a vote share of 10% each in a given constituency, ENOP will be 10 and if there are just two candidates in a constituency with a vote share of 90% and 10%, ENOP will be 1.2. Median ENOP calculations for the latest assembly elections for states with 10 or more Lok Sabha seats show that Assam, Karnataka, and Andhra Pradesh have the lowest median ENOP. Madhya Pradesh, Rajasthan and Chhattisgarh rank at 8th, 9th, and 12th positions. To be sure, the median ENOP for the same states from 2003-2023 reveals a different pattern. The median ENOP from 2003-2023 is the lowest for Gujarat (2.33), Andhra Pradesh (2.38), and Kerala (2.38). Madhya Pradesh and Rajasthan have a median ENOP of 2.78 along with Odisha. The median ENOP of Chhattisgarh for the same period is 2.94. West Bengal (2.44), Tamil Nadu (2.56), and Karnataka (2.7) have the lower median ENOP when compared to the states of Madhya Pradesh, Rajasthan, and Chhattisgarh.
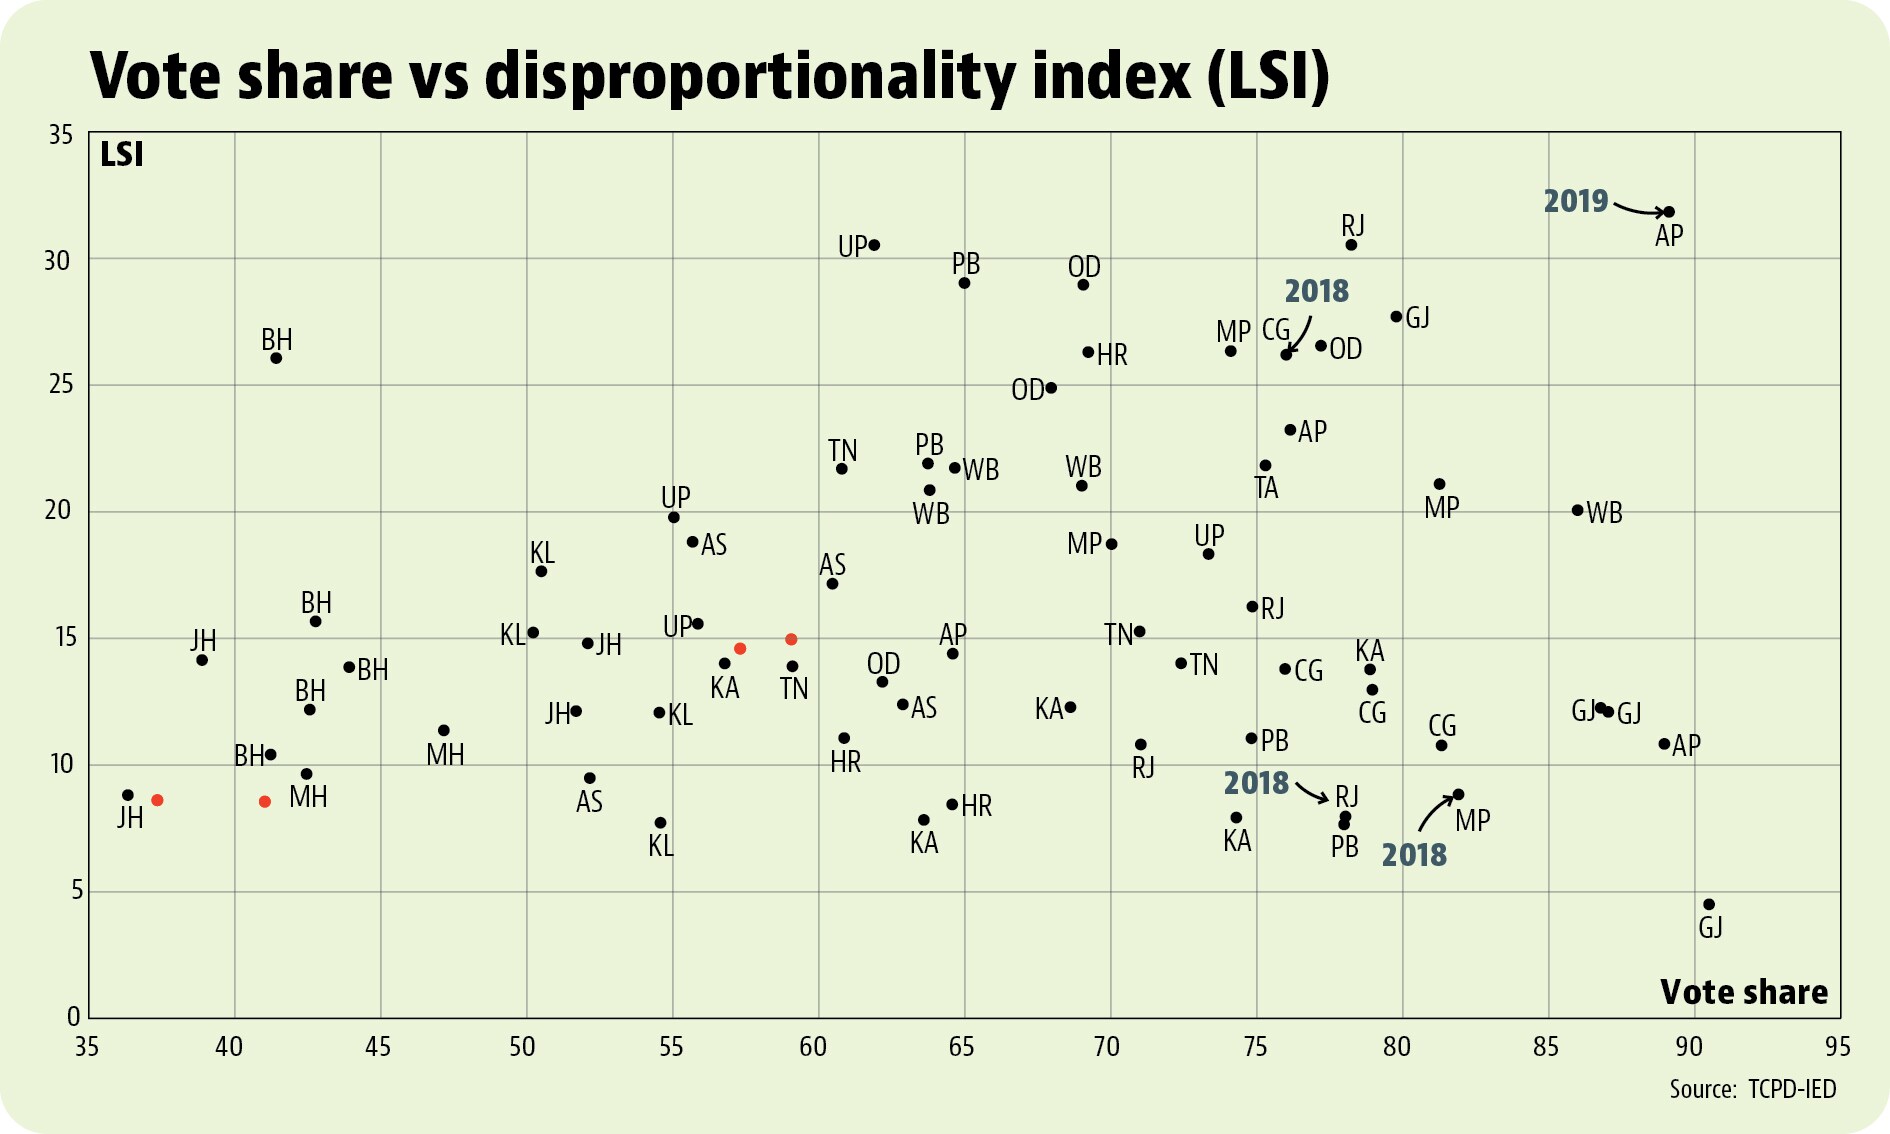
- Madhya Pradesh and Rajasthan have the most competitive bipolarity in the latest assembly pollsEven in the bipolar contests, there exists a huge disproportionality in terms of vote shares and seat shares. A party may not be able to translate its vote share into proportional seat share in an election. It’s not uncommon even in bipolar elections that a gap of a few percentage points in the vote share percentage between the top two parties may result in a huge difference in the seat share percentage. Thus, it is important to look at the disproportionality between vote shares and seat shares of the parties contesting the elections. The Least Square Index (LSI, developed by Michael Gallagher and modified by Arendt Lijphart) measures this kind of disproportionality. It is defined as the square root of half the sum of the squared differences of vote share and seat share. Its value ranges from 0 to 100. Higher values indicate greater disproportionality and vice versa. Competitive bipolar elections are ones with the higher combined vote share of the top two parties as well as lower LSI (in terms of vote share and seat share). Madhya Pradesh and Rajasthan have the most competitive bipolar elections for the latest assembly elections. They have significantly lower LSI as well as a higher combined vote share of the top two parties. Meanwhile, the Andhra Pradesh assembly elections in 2019 were the most disproportionate assembly elections for the latest rounds.