E-Paper



Number Theory: The economic learnings of Bihar's caste survey
Here are four charts which give a summary of what the report says about Bihar’s socio-economic landscape
Published on: Nov 8, 2023, 10:49:41 IST

 Prefer HTon Google
Share via


Copy link

The Bihar government tabled detailed socio-economic findings of the caste census in the state assembly on November 7. The 216 page document which has been made public contains detailed information on income, employment, assets and education of all 215 sub-castes which have been listed in the caste census.

Nishant Ranjan contributed to this story.
The economic learnings of Bihar's caste survey
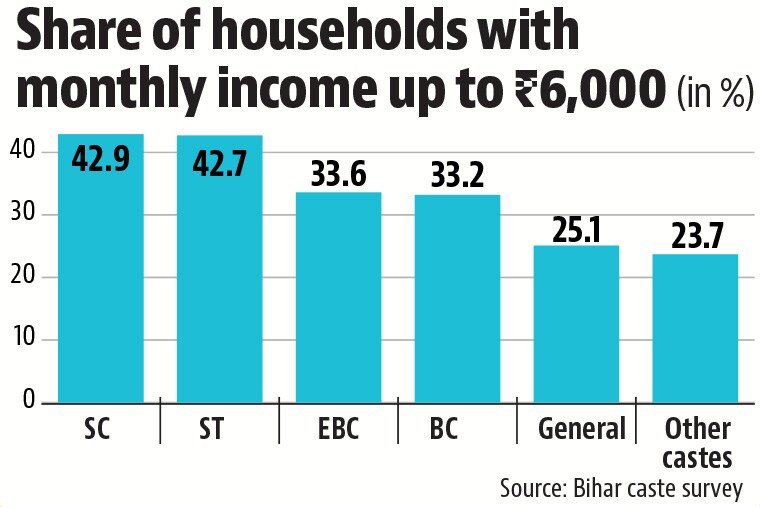
 More than a third of Bihar’s households earn less than ₹6,000 a monthThe report has collected self-reported data on monthly earrings of all 27.7 million households in the state. It shows that 34.1% of them earn less than ₹6,000 per month, which is the threshold decided by the Bihar government to classify a household as poor. The state’s parliamentary affairs minister, Vijay Kumar Choudhary, while speaking in the assembly said that the poverty headcount ratio given by the caste census report is close to the 33.8% poverty in Bihar as per the multidimensional poverty index released by the union government in July 2023 based on NFHS 2019-21. The share of poor households is the highest for Scheduled Caste (SC) and Scheduled Tribe (ST) groups, but it is not insignificant for households not belonging to SC-ST or Backward Class (BC) and Extremely Backward Class (EBC) groups as well. When seen in terms of relative shares – share of poor households from each social group adjusted for their overall share – SC and ST households are over-represented as a group, BCs and EBCs are in the same proportion as their population, and the non SC-ST-BC-EBC are under-represented.
- Under-representation for EBCs, SCs and STs in government jobs; upper castes are most over-representationThe caste census report also gives the number of persons employed in government jobs across caste groups and sub-castes. A comparison of relative shares in government jobs – number of persons with government jobs adjusted for share in population – shows that this number is less than one for EBCs, SCs and STs and more than two for persons who do not belong to the SC-ST-BC-EBC category. As far as the BCs are concerned, their relative share is slightly higher than one, which shows that they do have proportionate reservation. The social composition of government job numbers shows that currently mandated reservations – 16% for SCs, 1% for STs, 18% for EBCs and 12% for BCs – are being fulfilled for everyone except SCs in the state. To be sure, there is significant intra-group inequality, too. For example, among castes that have at least 1% share in Bihar’s population – there are 25 of them – some backward castes are among the most over-represented in government jobs and others are among the most under-represented compared to their representation in the workforce overall. The top five castes in the list of 25 most over-represented in government jobs are Bhumihar, Rajput, Brahmin of the non-SC-ST-BC-EBC category and Kurmi and Kushwaha of the BC category. The five most under-represented castes are Mushar of the SC category, Mallha, Dhuniya, Noniya of the EBC category, and Surjapuri Muslim of the BC category. Because the report does not give age data on workers in government jobs, it is difficult to ascertain their vintage and whether the number of government jobs has fallen in recent years.
- What is the social composition of the rich in Bihar?The highest income category in the report is more than ₹50,000 per month. Of the 1.08 million households which are above this threshold, 39.6% belong to non SC-ST-BC-EBC groups. This means that their relative share among the richest households is 2.5 times their share in overall households. This number is 1.1, 0.6, 0.4 and 0.6 for the BCs, EBCs, SCs and STs in the state. As is expected, the over- or under-representation can be much more extreme for individual castes. Among the 25 big castes, the five most over-represented among such rich households are Bhumihar, Rajput, Brahmin, Baniya, and Kurmi; and the five most under-represented are Mushar, Mallah, Dhuniya (Muslim), Rain or Kunjra (Muslim), and Surjapuri Muslim.
- To be sure, social composition of the really rich could be slightly differentUnless one has access to unit level data it is difficult to understand this because an income threshold of ₹50,000 per month can hardly be considered as really rich. The report does give a hint about who the really rich could be in the state. One of the statistics in the report is about students from Bihar studying abroad. One can assume that a household sending their child to study abroad will have to be really rich. Of the 23,738 such students, non SC-ST-BC-EBC number is the highest at 8,500 but the numbers for BCs and EBCs is not insignificant either. What is interesting is the fact that the sub-caste which has the highest number of students studying abroad is Yadav. This suggests that Yadavs have the largest number among the really rich in Bihar apart from being the largest sub-caste in the state.