
 E-Paper



Number Theory: Haryana economy much ahead of Punjab's, but most residents poorer
How the economic fortune and, with it, the political economy of these two contiguous states has diverged in the latter half of the post-reform period in India?

 Prefer HTon Google


Haryana, which was carved out of Punjab as a separate state in 1966, will elect a new assembly in a month. The politics of the two states today is very different -- a reflection of the religious demographics of the two regions. 58% of Punjab’s population is Sikh while 87% of Haryana’s population is Hindu. The difference in religious demographics aside, a comparison of economies of Punjab and Haryana can give a useful insight into how the economic fortune and, with it, the political economy of these two contiguous states has diverged in the latter half of the post-reform period in India. Here are four charts that explain this in detail.

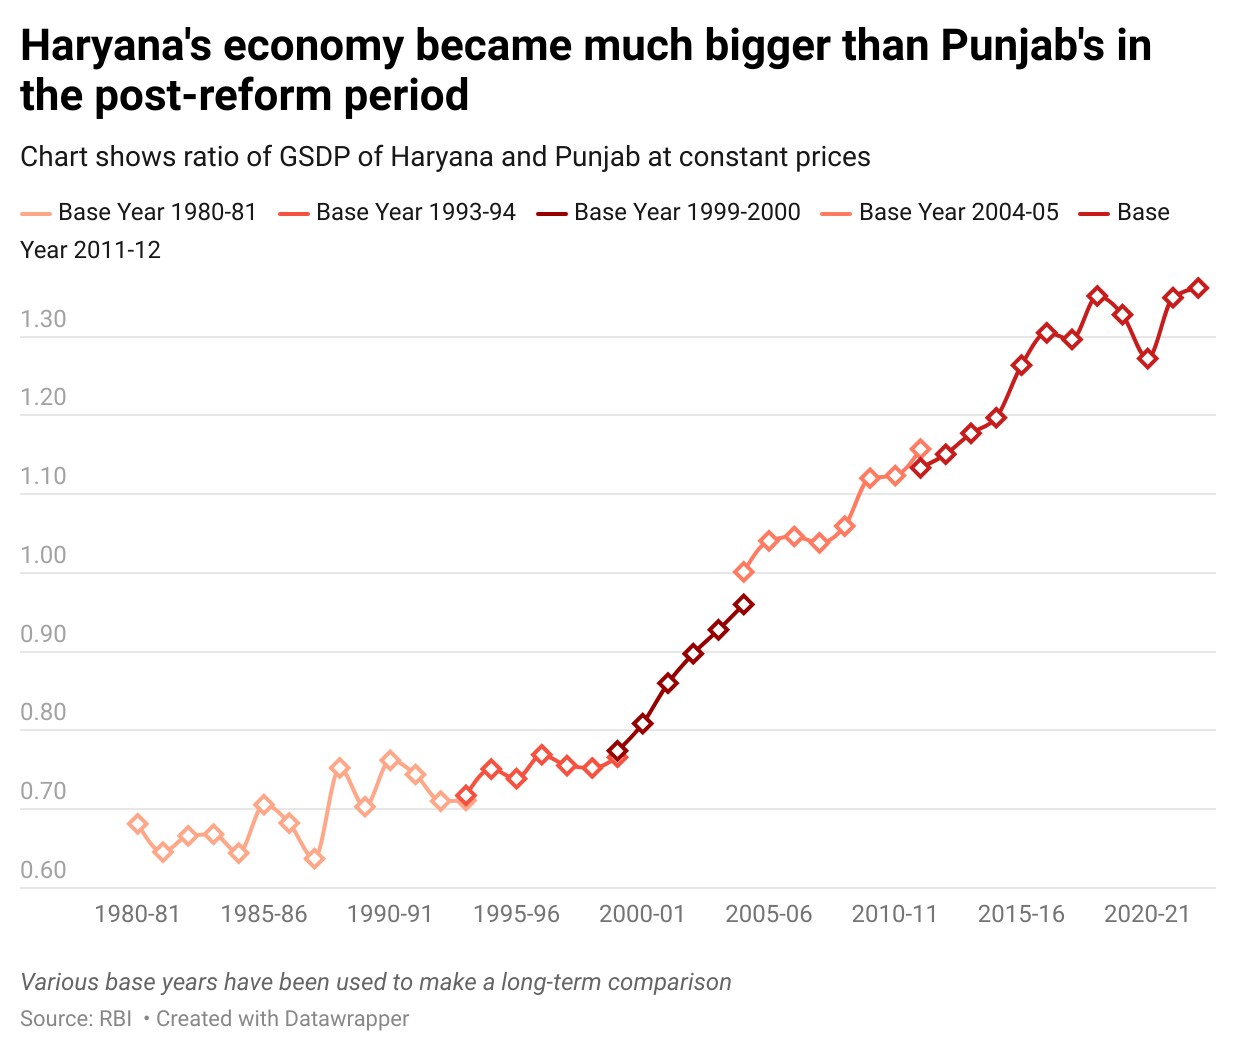
 Haryana’s economy surged ahead of Punjab in the post-reform period…The earliest state-wise GSDP data available on RBI’s website is for 1980-81. It shows that Haryana’s GSDP (at constant prices) was about two-thirds (68%) of Punjab’s at that time. While Haryana did do some catching up in terms of GSDP by the 1990s -- the GSDP ratio of Haryana and Punjab reached 76% -- the first half of the 2000s saw Haryana’s GSDP bridging the gap. Haryana’s GSDP today is 1.4 times of size of Punjab’s. Even in terms of per capita GSDP, Haryana is ahead of Punjab. See Chart 1: Ratio of GSDP of Haryana and Punjab
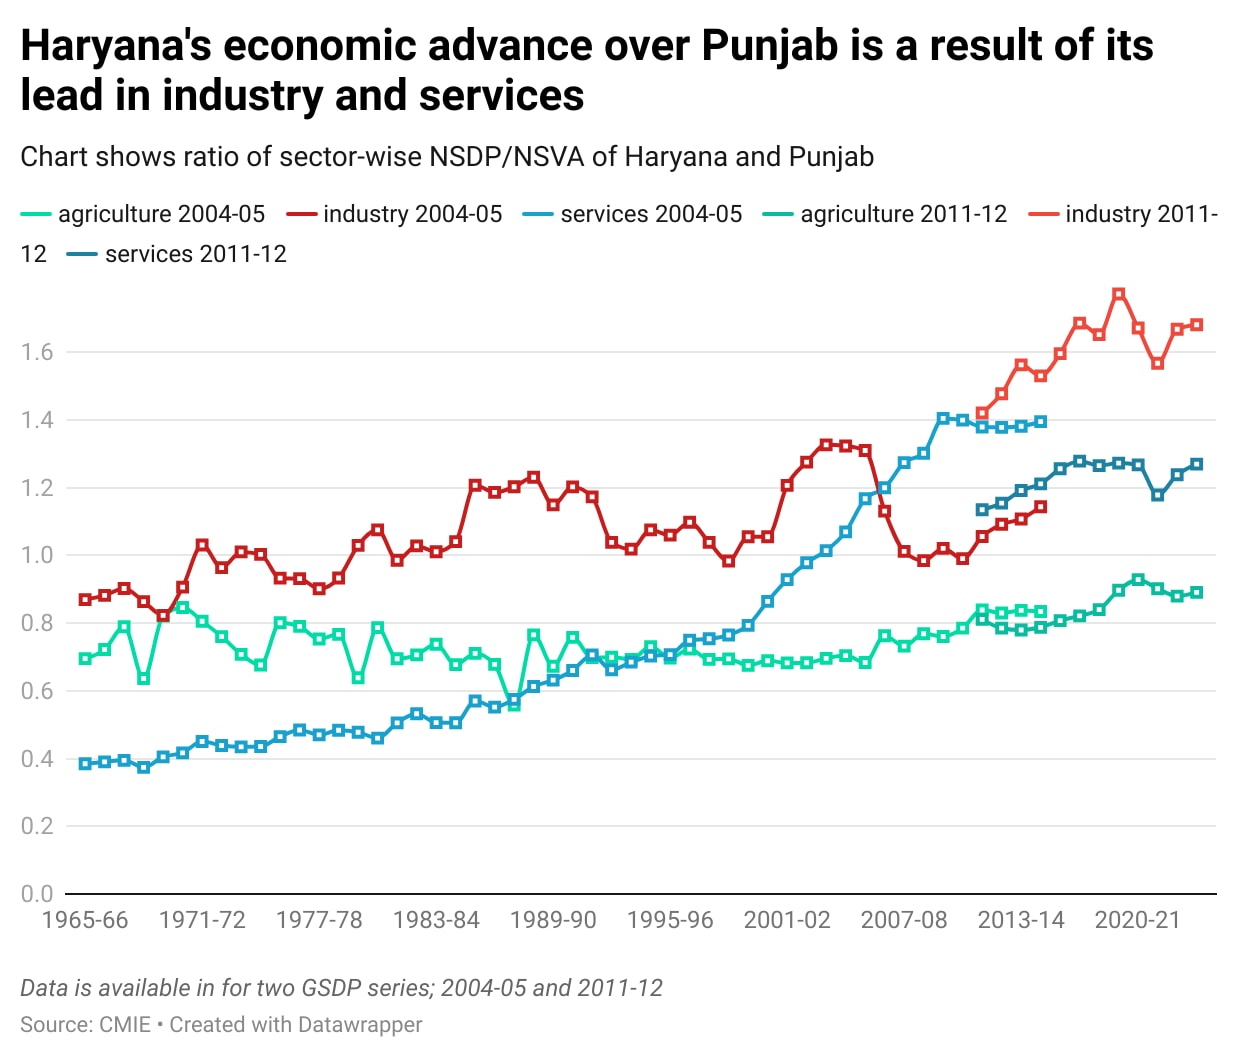
- …thanks to an advantage in industry and servicesThe sector-wise net state domestic product (NSDP) or net state value added (NSVA) data for Haryana and Punjab shows that the former’s economy surpassing the latter’s is a result of advances in industry and services. In fact, Punjab’s farms, notwithstanding their sustainability problems, still produce more value than Haryana’s, and the latter’s agricultural NVSA was 90% of the former’s in 2023-24. What is even more interesting in the data is that Haryana’s lead over Punjab in terms of service sector output seems to have plateaued in the last decade or so, while it has made bigger gains when it comes to output in the industry sector. See Chart 2: Ratio of sector-wise NSDP/NVSA of Haryana and Punjab
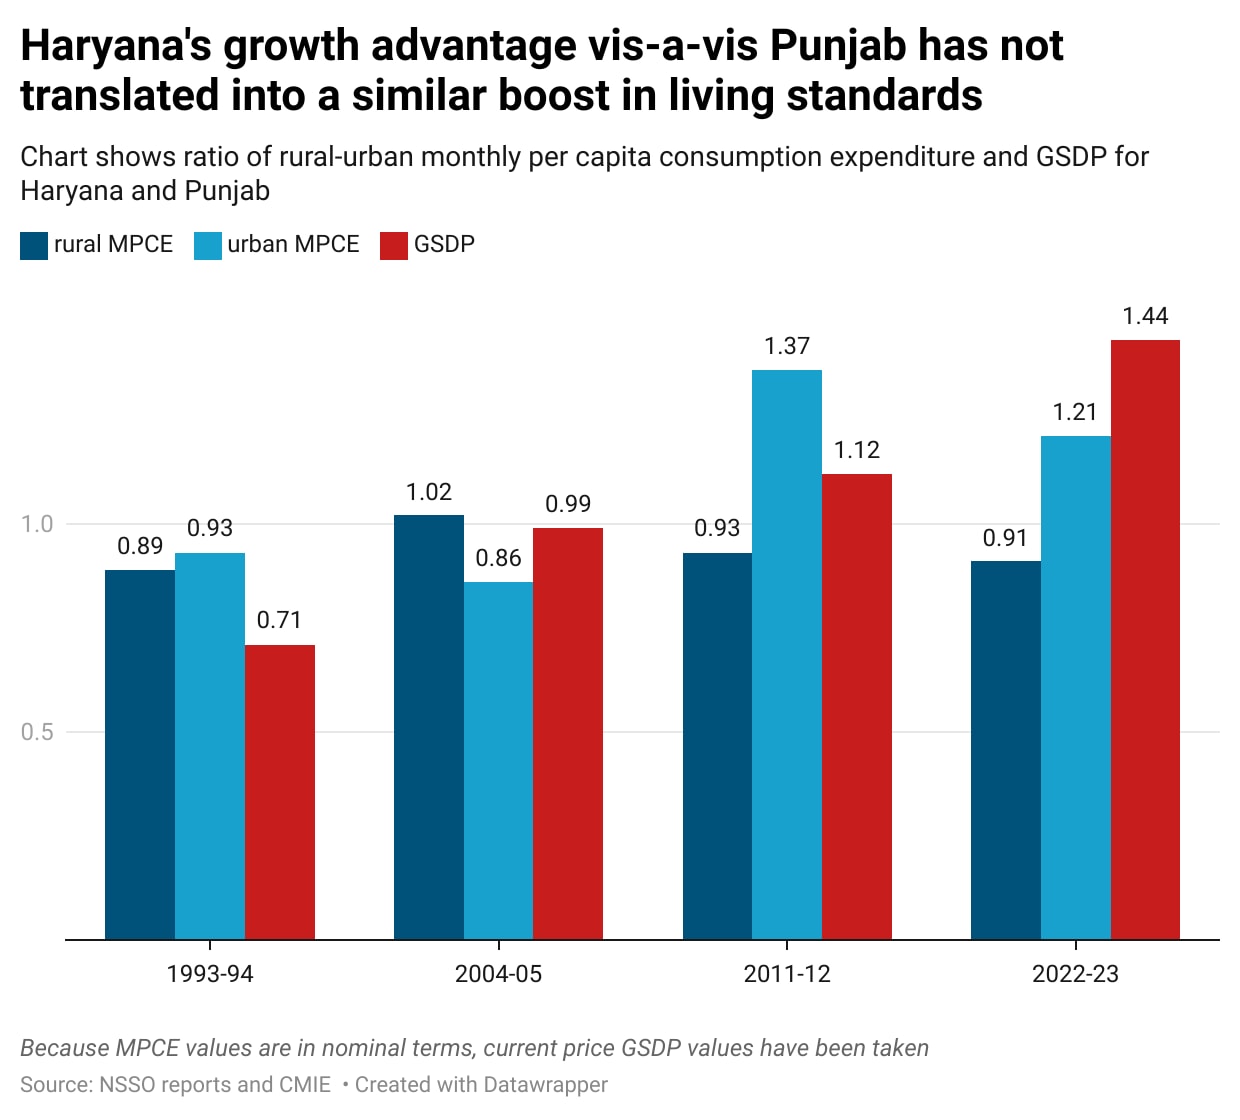
- But Haryana’s living standards have not increased as much as its GSDP has vis-à-vis Punjab…This comes out clearly if one compares rural and urban monthly per capita expenditure (MPCE) and GSDP of Punjab and Haryana from 1993-94 onwards. Haryana’s rural and urban MPCE lagged Punjab’s in 1993-94 which was to be expected given that its GSDP was also lower than Punjab’s. In 2004-04, when the GSDP of these two states was almost at par, Haryana caught up with Punjab in rural MPCE but lagged in urban consumption. By 2011-12, when Haryana’s GSDP became much larger than Punjab’s, its urban MPCE surged ahead but rural advantage atrophied. The period between 2011-12 and 2022-23, curiously, has seen the Haryana-Punjab GSDP gap rising to its highest ever level, but the MPCE advantage has fallen in both rural and urban areas. Clearly, the growth advantage in the last decade has not done much to boost mass income levels (consumption is a good proxy for it) in Haryana. See Chart 3: Ratio of rural-urban MPCE and GSDP of Haryana and Punjab
- …and decile-for-decile, 70% of Haryana’s population is worse off than Punjab’sA comparison of decile-class MPCE data from the 2022-23 Household Consumption Expenditure Survey (HCES) for Punjab and Haryana shows that the bottom 70% of the population in Haryana actually has lower MPCE levels than the bottom 70% of the population in Punjab. It is only the top 10% of Haryana’s population that spends significantly more than their counterparts in Punjab. To be sure, both Punjab and Haryana have higher MPCE levels than the all-India average. 2022-23 HCES data also shows the Gini coefficient of (MPCE) in Haryana was 0.31 to just 0.25 for Punjab. Among 36 states and Union territories, Haryana’s Gini was the fifth-highest while Punjab’s was 30th. The Gini coefficient takes values between 0-1 and measures the extent of equality, or lack of it, for a given distribution where zero signifies perfect equality and one perfect inequality. See Chart 4: Decile-wise MPCE of Punjab and Haryana

What explains Haryana’s high growth but low trickle-down economic trajectory in the last couple of decades? Anecdotally speaking, the answer could be Gurugram, which has emerged as one of the biggest centres of India’s new economy but does not do much for the blue-collar workforce of the state. Since Haryana does not publish district-wise GDP estimates, this question is difficult to answer factually, but the rise of nativist politics demanding things such as reservations for local workers in private sector jobs etc. shows that politics is not contingent on official data.
Abhishek Jha contributed to the datawork for this story.


