
 E-Paper



Implications and drivers of the churn in labour markets — Part 2 | Number Theory
.
Updated on: Jul 29, 2025, 09:11:30 IST

 Prefer HTon Google
Share via


Copy link

The first part of this series explained how stable employment category shares in the Indian labour market hide a large churning within it and used data to show that most of the movement takes place across precarious forms of employment. The second part will explain the key drivers and implications of this process.
Rosa Abraham and Surbhi Kesar teach economics at Azim Premji University, Bengaluru and School of Oriental and African Studies, London. The views expressed are personal.
Implications and drivers of the churn in labour markets
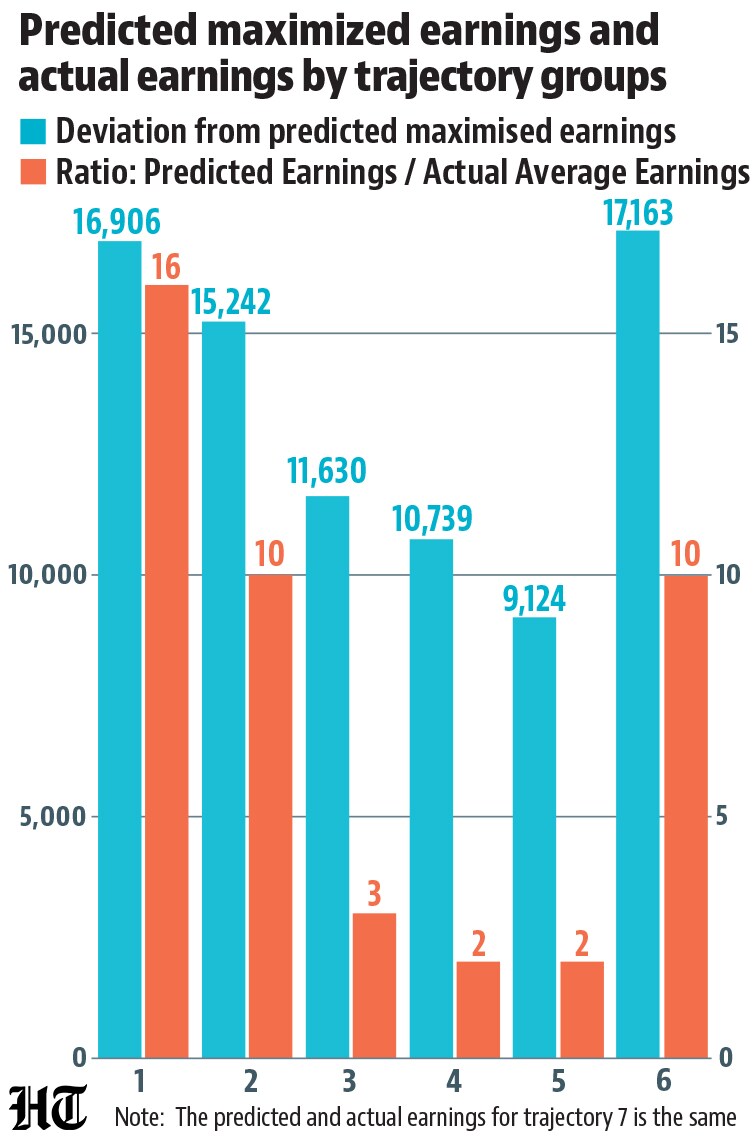
 A broken ladder to informalityEconomic theory tells us that flux can be a healthy sign in a labour market if it implies an upward transition from informality to formal jobs, whereby informal jobs can act as a stepping stone to workers by providing relevant skills and experience. However, there is no dominant path leading informal workers to formal salaried jobs in India, challenging the idea of a “job ladder” towards better formal jobs. In fact, workers are as likely to move into a stable permanent salaried trajectory from temporary salaried work as they are from unemployment and almost all workers in permanent salaried work have continued to be in this work in past periods. To be sure, one might argue that even if workers aren’t in formal salaried jobs, they are at least in their optimal employment paths that best reward their characteristics such as education, experience etc. If this were the case, it would imply that there is no strict segmentation between formal and informal work, rather workers are simply sorting themselves into whatever is best suited for them given their characteristics. Once again, data shows that this is not the case. We compare actual and predicted earnings in trajectory groups (discussed in the first part) to show that individuals in all trajectory groups earn significantly less than they would have had they been rewarded for their characteristics like in Trajectory 7 (across formal salaried employment). This indicates a segmentation in the labour market, where formal and informal sectors operate with strict separation and workers often do not have access to formal work trajectories that can maximize their potential earnings.
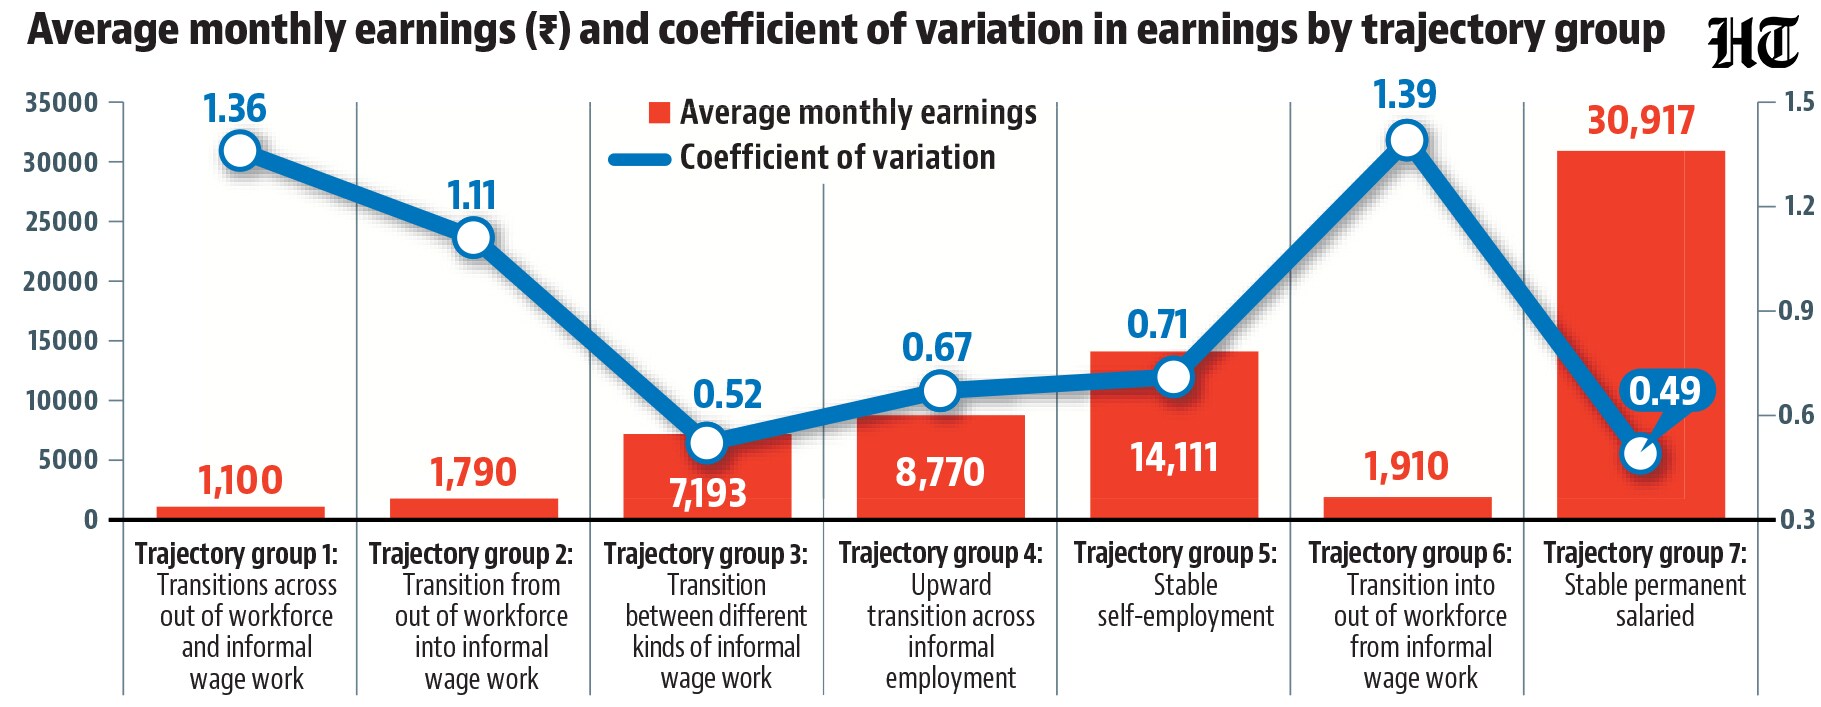
- Development trajectory turning on its head - from wage work to self-employmentAnother curious case that emerges from the trajectory analysis is the higher earnings of self-employed trajectory groups relative to informal forms of regular or casual wage work. This is completely counter to the intuitive wisdom of economic development typically expected to shift workers from low-productivity self-employment into wage work, and eventually into secure formal jobs. Income from stable self-employment—though modest and half of permanent salaried trajectory at ₹14,111 per month—often exceeds those from informal wage work and it is the most stable of the informal employment options, represented by the lowest Coefficient of Variation. This does not indicate that self-employment is desirable — far from it, as most self-employed are smallholders or run micro-enterprises with limited growth potential. Instead, it highlights how informal wage work has become highly precarious and poorly paid, no longer a stepping stone to formality, upending and reversing the expected development path.
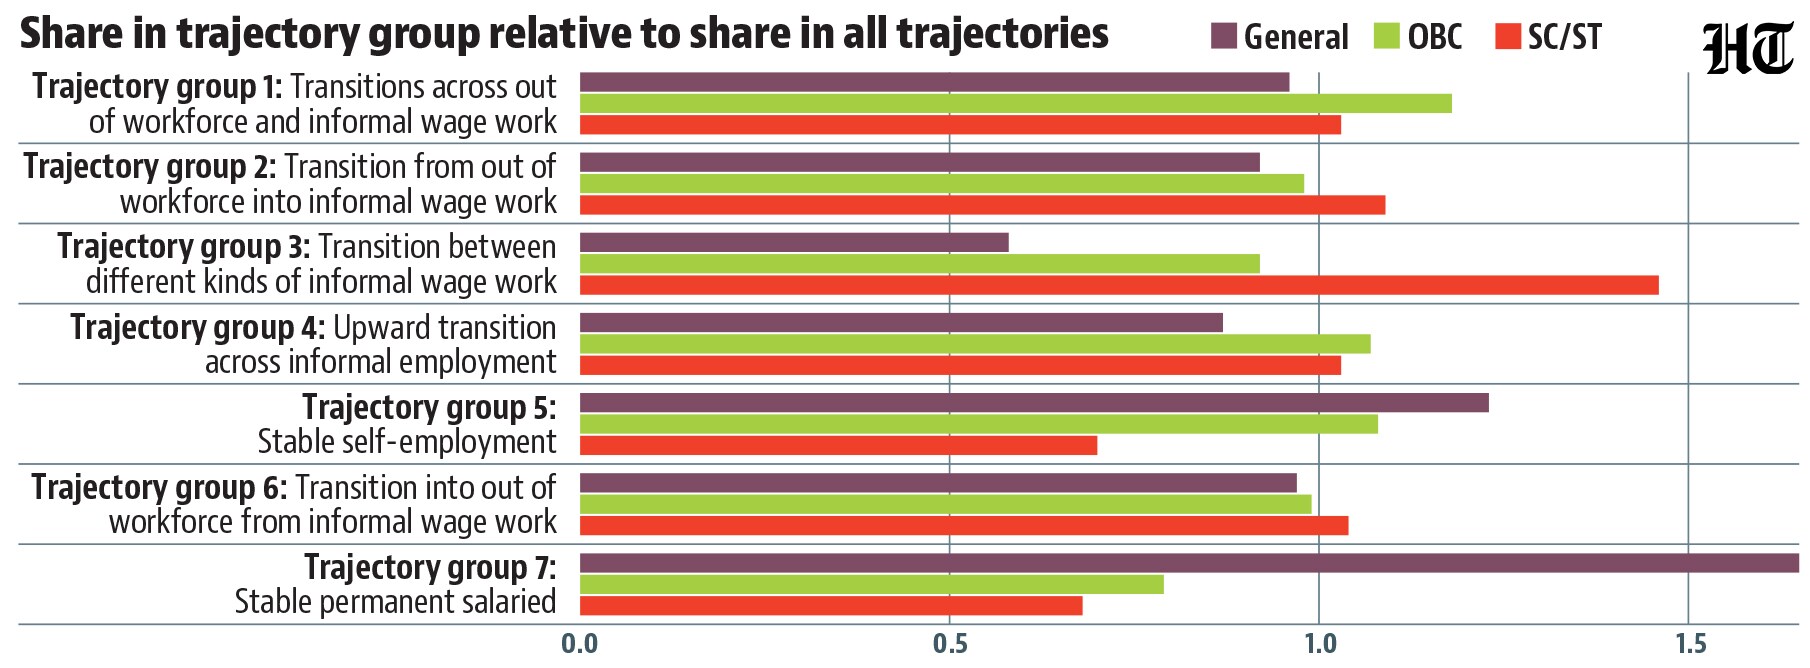
- Caste is a reality we need to accept and find solutions forAn inclusive growth and development process is also expected to dilute differences based on identities. Unfortunately, the differences have persisted, and these trajectories help us make sense of some of the channels through which this persistence happens. The membership to trajectories is strictly - and expectedly - stratified along caste lines. The representation index allows us to see how a caste group is represented in a particular trajectory relative to its proportion in the overall sample of all trajectories. A value of one indicates that they are represented in that trajectory in proportion to their share in the overall population. We can see that Scheduled Caste (SC) and Scheduled Tribes (ST) are under-represented and the General caste groups are over-represented in permanent salaried trajectory and always self-employed trajectories, i.e. both of the ‘stable’ and relatively higher earnings trajectory. In contrast, SC/STs are over-represented in low-income trajectory groups capturing transitioning across different informal wage work arrangements, which is also the trajectory where general caste groups are under-represented relative to their proportion in the workforce.
- What we understand...Despite high economic growth, the labour markets in India, characterised by a high informality, are far from delivering the promise of an inclusive development process. A large volume of workers seems to be caught in flux between different forms of informal work, without a pathway to transition into secure formal jobs, unravelling the development trajectory.

Unlock a world of Benefits with HT! From insightful newsletters to real-time news alerts and a personalized news feed – it's all here, just a click away! -Login Now!


