E-Paper



Number Theory: Charting the Sensex and its surge to 80,000
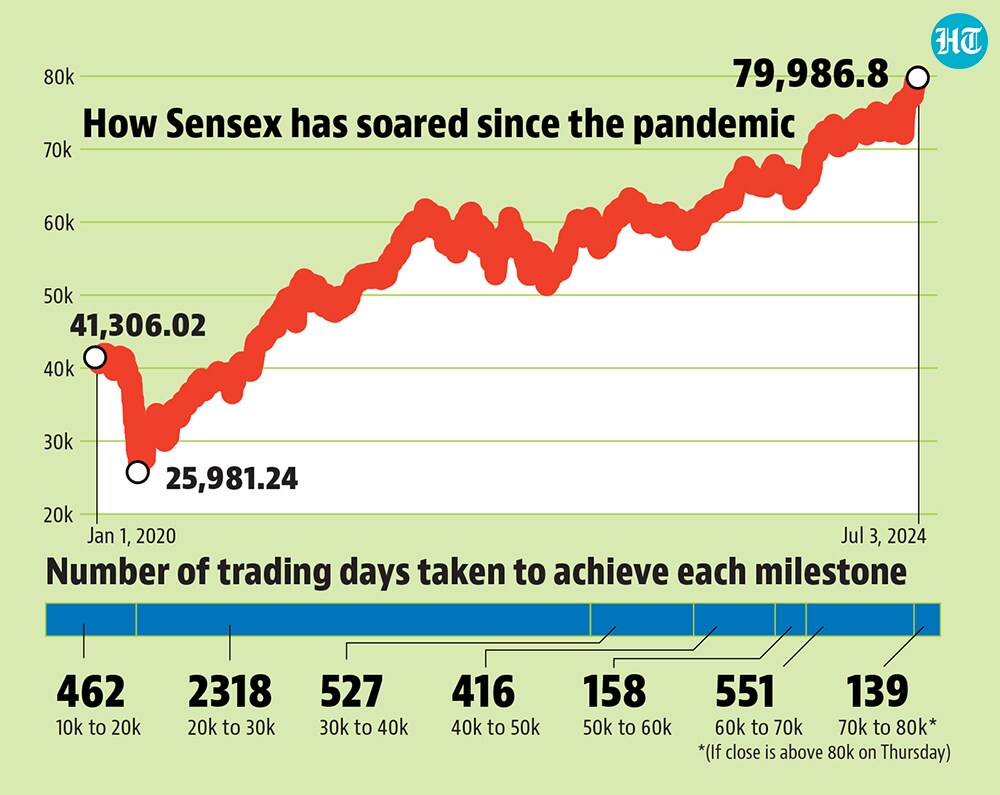
Sensex hit the milestone of crossing 10000 on February 7, 2006. Since then, on an average, it has taken 653 trading days to add each new 10000 points.
Published on: Jul 4, 2024, 08:29:28 IST

 Prefer HTon Google
Share via


Copy link

India’s benchmark equity market index, BSE Sensex breached the 80000-mark mark during the early hours of trading on Wednesday for the first time in its history. Although, it closed slightly lower at 79,986.80 on Wednesday, the index is expected to achieve the milestone of closing above 80,000 over the coming days. Meanwhile, NIFTY50 also ended in green on Wednesday, closing at 24,286.50. As the rally in the equity market continues, the charts below explain their historical growth trajectory.
Charting the Sensex and its surge to 80,000
 The journey to 80,000Sensex hit the milestone of crossing 10000 on February 7, 2006. Since then, on average, it has taken 653 trading days to add each new 10000 points. However, this hasn’t been uniformly distributed. For example, while it only took 462 trading sessions for the Sensex to jump from 10,000 to 20,000, the journey from 20,000 to 30,000 took 2,318 days. Although, the Sensex closed slightly lower than 80,000 on Wednesday, if it manages to close above the figure within 20 trading days, the jump from 70,000 to the next 10,000 will have taken the fewest days so far. Sensex breached 70,000 on December 14, 2023, and only 138 trading days have passed by since then, which is lower than the 158 it took to move from 50,000 to 60,000. To be sure, each successive addition of 10000 points to the Sensex means a lower growth in proportional terms. For example while the increase from 10000 to 20000 entailed a 100% growth, the move from 70000 to 80000 would mean a growth of just 14.3%.
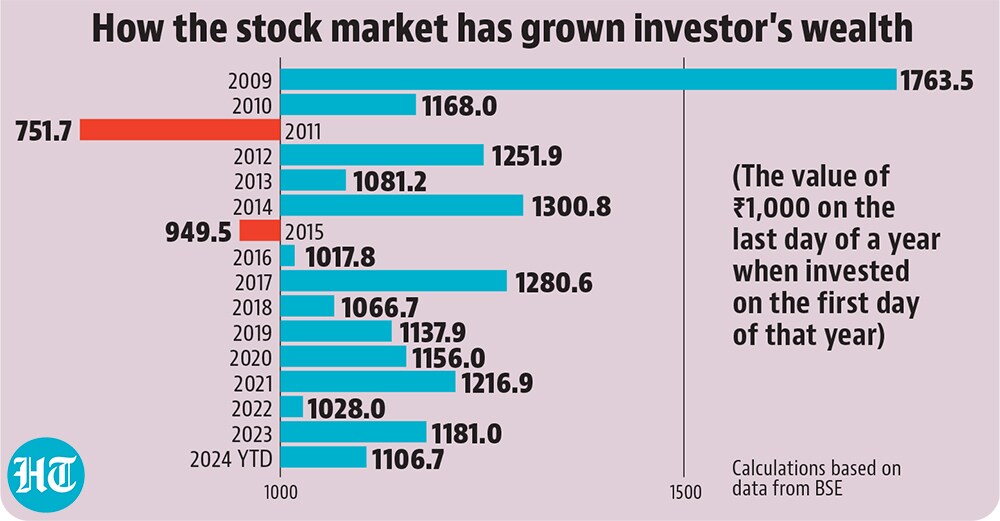
- How investor wealth has grownThe BSE Sensex has grown by as much as 707.7% in the last 15 years. This means that the those who had invested in the markets at the beginning of 2009 would have seen their investment become eight times the original amount. In terms of annual growth in the last 15 calendar years, 2009 was the year of best returns for the Sensex. In 2024, till date, the benchmark index has seen a growth of nearly 11%.
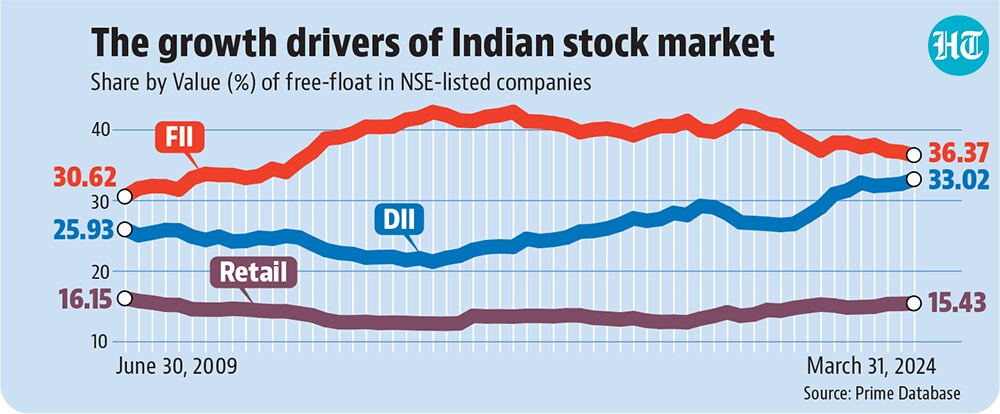
- Growth drivers of Indian marketsDo equity markets see participation from both foreign and domestic investors? Which of them have been driving the equity market rally? Data from Prime Database shows that Foreign institutional investors (FIIs) were especially key to the growth of the market from 2009 to 2016. In fact, the percentage of free-floating shares held by FIIs in companies listed in the NSE reached as high as 42.5% in March 2016. However, recent years have shown increased participation of domestic investors--both institutional and retail. This is evident by the fact that the gap between FIIs and Domestic Institutional Investors (DIIs) has come down over the years. On the basis of their value, FIIs currently hold 36.4% of free-floating share in NSE-listed companies, while DIIs hold 33%. The rise of DIIs could be to an extent attributed to the popularisation of systematic investment plans (SIPs) in mutual funds. On the other hand, retail investors account for 15.4% of such shares. Free-floating shares are those shares that are readily available for trading as they exclude locked-in shares such as promoters’ holding.
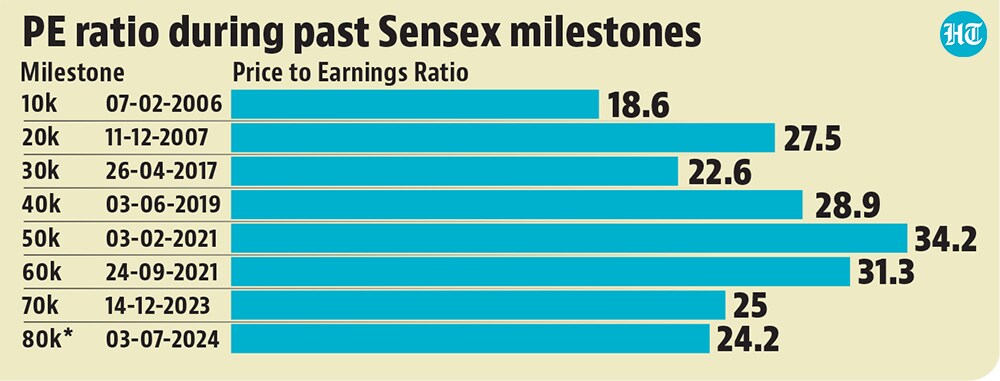
- Are Indian markets overvalued?A comparison of PE (price earnings) multiple of Sensex with the benchmark indices of major economies around the world, shows that it is relatively expensive. PE multiple is the ratio of share price and earnings per share and a higher value indicates exuberance in the equity market. The PE ratio of the Indian benchmark index currently stands higher than that of other emerging economies like Brazil, Vietnam and Thailand, as well as China. To be sure, the PE multiple of the Indian market has been higher in the past. In fact, the PE multiple was higher than what it was on Wednesday when the Sensex crossed the 20,000, 40,000, 50,000 and 70,000 marks.