E-Paper



Number Theory: How much hotter than normal is Ladakh now?
On July 28, the Leh grid was 6.8°C warmer than normal for the day. This is alarming because the daily temperature of the grid normally peaks by June 27.
Published on: Aug 1, 2024, 09:12:45 IST

 Prefer HTon Google
Share via


Copy link

The Leh airport in the union territory (UT) of Ladakh has seen flights being cancelled repeatedly this week. High temperatures have decreased air pressure, which is already low at such high altitudes, to a level that is unsafe for operations. Is the UT, or Leh in particular, experiencing very high temperatures? Data suggests that this is indeed the case. With Ladakh serving as a storehouse of ice and snow, high temperatures in the region have bigger implications than just cancelled flights. The snow pack in Ladakh is also the lowest this year in satellite records.
How much hotter than normal is Ladakh now?
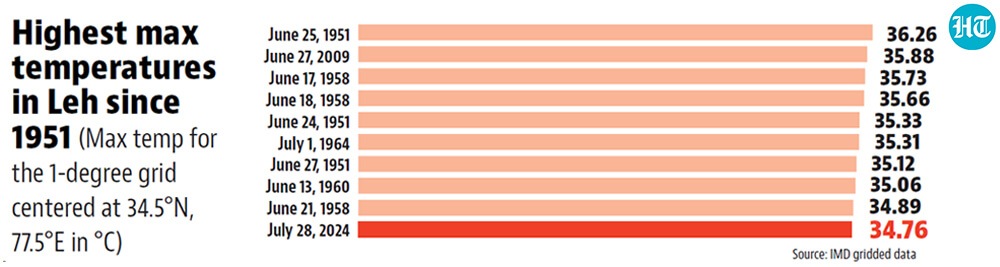
 Sunday was possibly the tenth hottest recorded day in LehLong-term data for Leh is not publicly available. However, the India Meteorological Department (IMD) publishes data for 1° grids, which are boxes bound by latitudes and longitudes one degree apart. The grid in which Leh is located has its centre at 34.5°N, 77.5°E. This grid experienced a maximum temperature of 34.76°C on July 28. This is the tenth hottest recorded day for the grid since January 1, 1951.
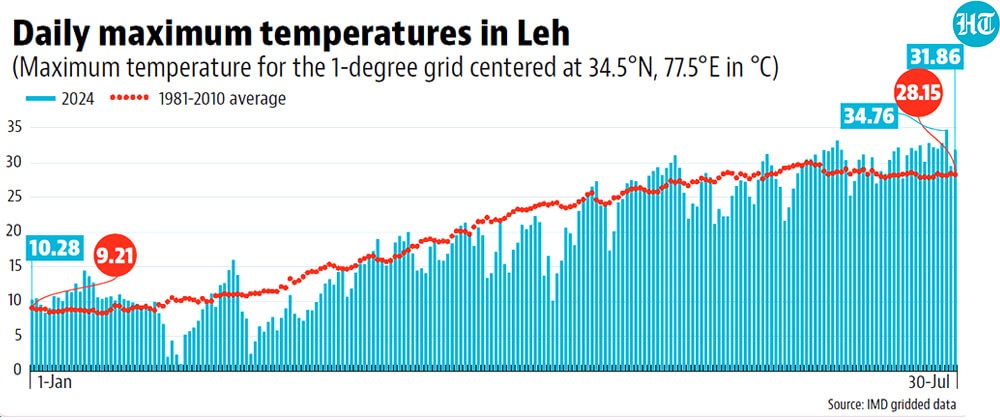
- But it is its deviation from normal in the past week that should cause alarmIMD considers the average during 1981-2010 as the normal for temperature. On July 28, the Leh grid was 6.8°C warmer than the normal for the day. This is alarming because the daily temperature of the grid peaks by June 27 on the normal chart. This year, the hottest day of the year so far at the grid was July 28, a month later. Among the top ten hottest recorded days at the grid, July 28, 2024 is the only one later than July 1. Similarly, while July 29 and July 30 are ranked relatively cooler (“only” 2,086th warmest and 323rd warmest among 26,844 days), they were 1.2°C and 3.7°C warmer than normal. It is also possible that the absolute temperature at the Leh airport was higher than the grid overall. This is possible because the grid’s size is very large (approximately 100 km x 100 km) and individual places in it can be warmer or cooler than the grid’s average temperature. Flight operations were disrupted at the Leh airport even after Sunday.
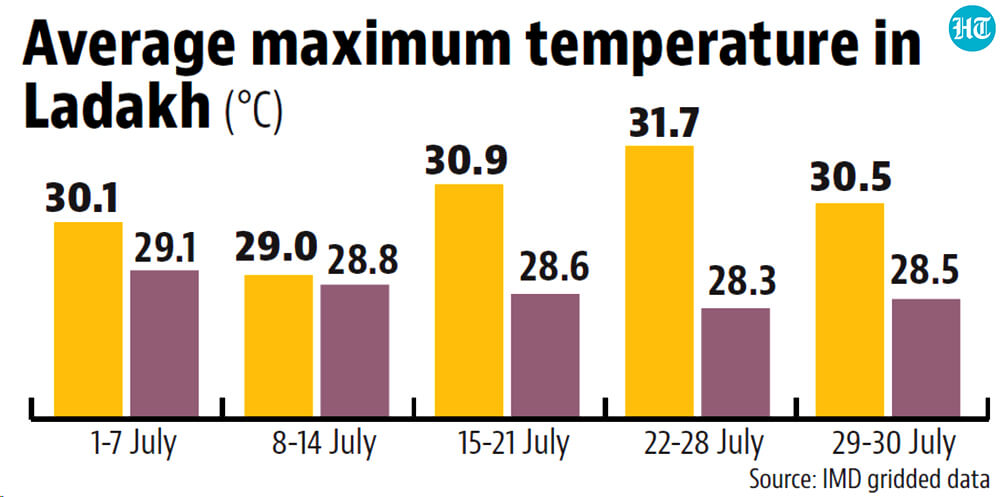
- Not just Leh, even Ladakh is experiencing a very warm JulyAs expected, this was the second warmest July since 1951 (up to July 30) in the Leh grid. However, the heat was not limited to Leh. This was also the fifth warmest July for Ladakh taken as a whole and 1.75°C warmer than normal. The seven-day rolling average of maximum temperatures was the highest ever this year for every day from July 27 to July 30. As was the case with Leh, July 28 was also a case of extreme heat for the UT as a whole. The average maximum for Ladakh on the day was the 56th highest for any day since January 1, 1951. To be sure, the statistics for Ladakh have more uncertainty than for just the Leh grid. IMD’s gridded data had just 5-8 grids in the UT up to the 1960s. The number increased to the current levels of 16-17 grids only from the 1970s.
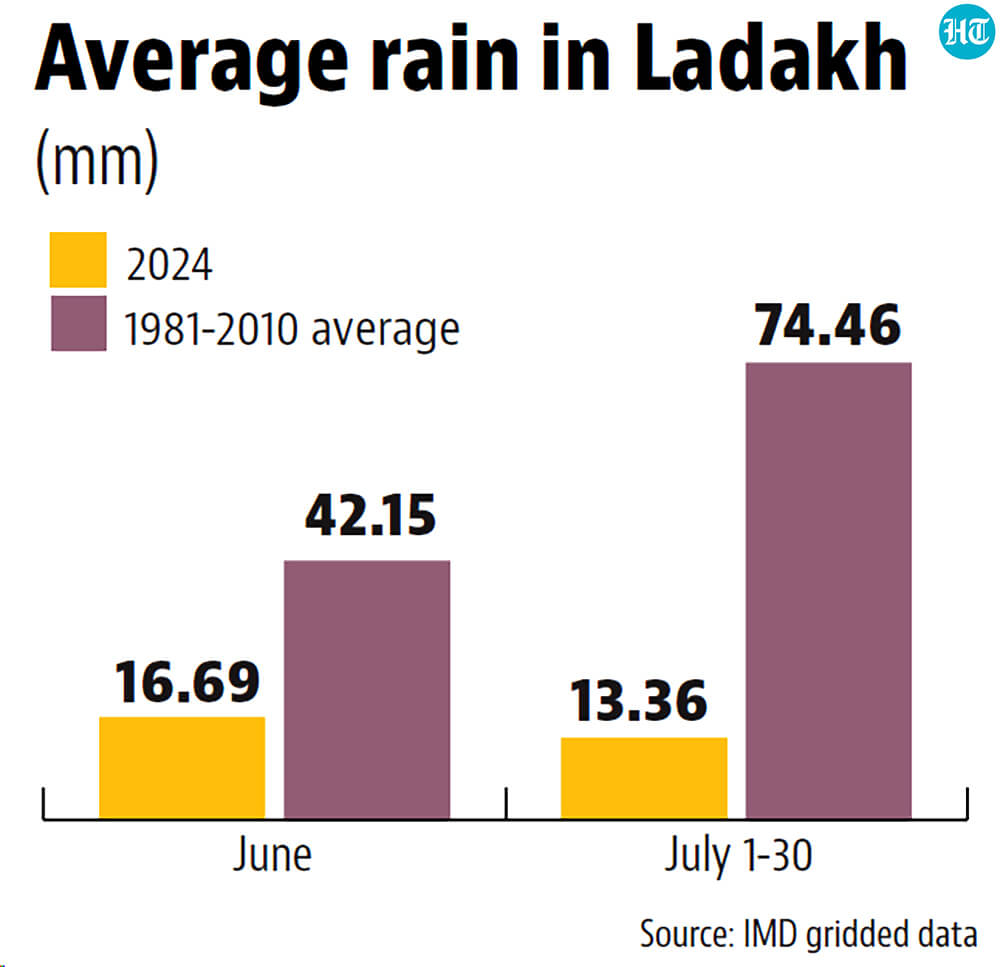
- High temperatures this July in Ladakh are partly a result of a dry monsoonNumbers bear this out. Since June 1 – the first date of the official monsoon season – the UT has received just 30 mm of rain, compared to the 1971-2020 average (the Long Period Average or LPA considered the normal for rain) of 116.6 mm. Neither June or July rainfall has been anywhere near the LPA. June rainfall had a 60% deficit and the July so far has a 82% deficit compared to the LPA.
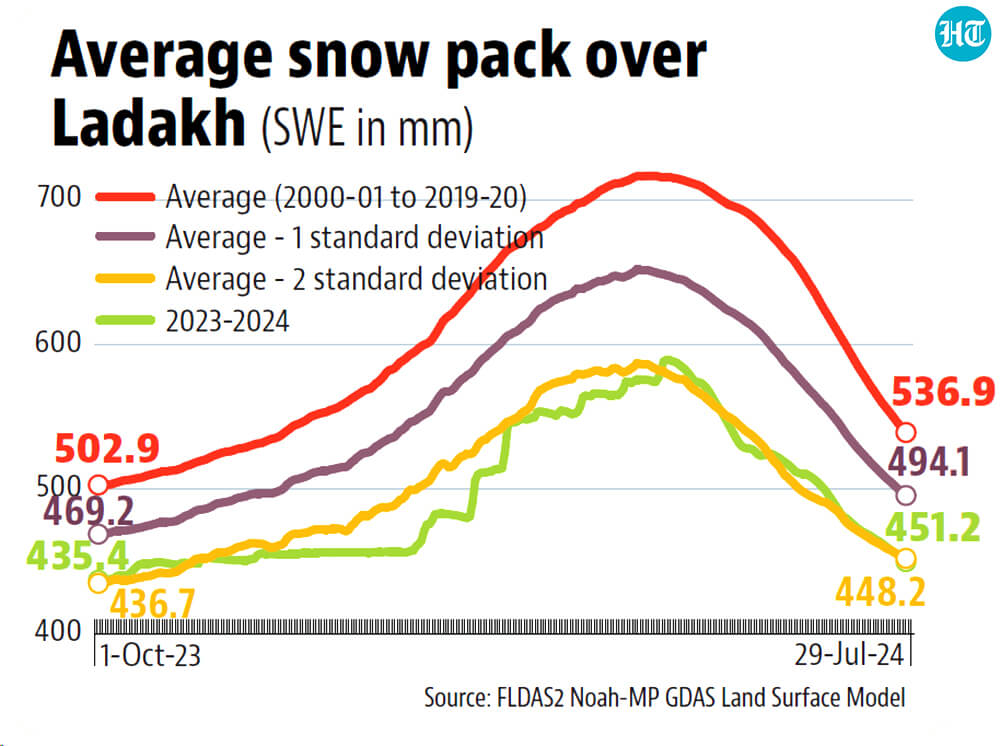
- High mercury and low precipitation have pushed the snow pack to its lowestThis has been a problem seen throughout this snow cycle, taken to start here on October 1, when the snow pack starts building. Of the 303 days since October 1, the average snow pack over the Ladakh region has been at the lowest three levels for the day since the 2000-01 cycle on 293 days. On July 29 (the latest available data), it was at its lowest level for the day. This snow pack is also very far from normal: 16.5% less than the average snow pack in the first twenty years of the data (2000-01 to 2019-20). This is 2.1 standard deviations away from the average. Standard deviation measures the average deviation of a set of numbers from their average. Values beyond one standard deviation are considered outliers from the set. To be sure, for the sake of simplicity, the average snow pack here was calculated for the rectangular box bounding Ladakh, rather than the exact political boundaries of the UT. If the snow pack trend does not reverse, flight disruptions might be the least of the problems because of heat in this region.