E-Paper



Number Theory: What do onions & air-tickets tell about India’s consumer economy
Here’s what HT’s detailed analysis of unit level data from the Household Consumption Expenditure Survey (HCES) conducted in 2022-23 shows
Published on: Oct 30, 2024, 10:06:58 IST

 Prefer HTon Google
Share via


Copy link

Religious festivities and sentiments aside, Diwali also marks the peak of consumer spending in large parts of India. From humble earthen lamps to luxury cars, a large part of the country’s population buys something around Diwali. This makes it a good occasion for a detailed look at the inequality in India’s consumption spending, albeit, not related to the festival itself. Here’s what HT’s detailed analysis of unit level data from the Household Consumption Expenditure Survey (HCES) conducted in 2022-23 shows.
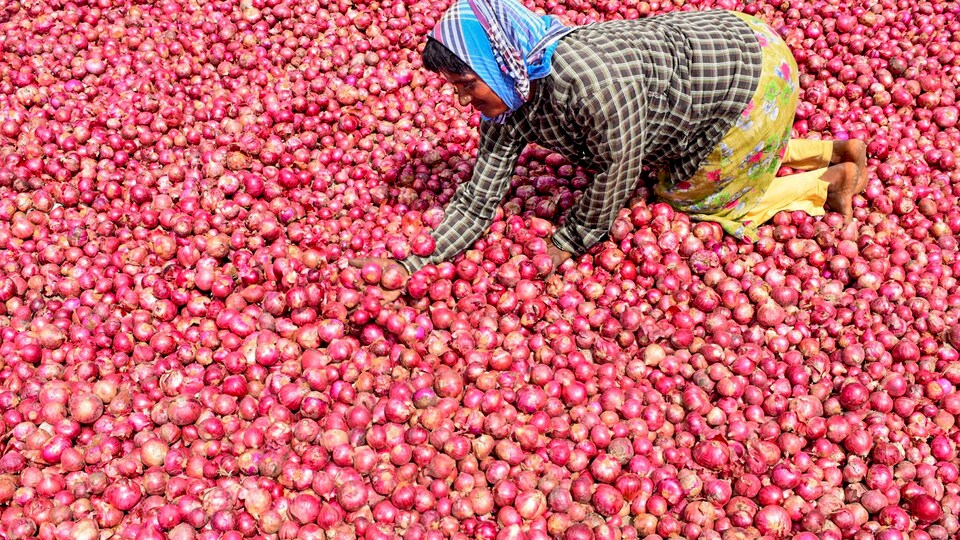
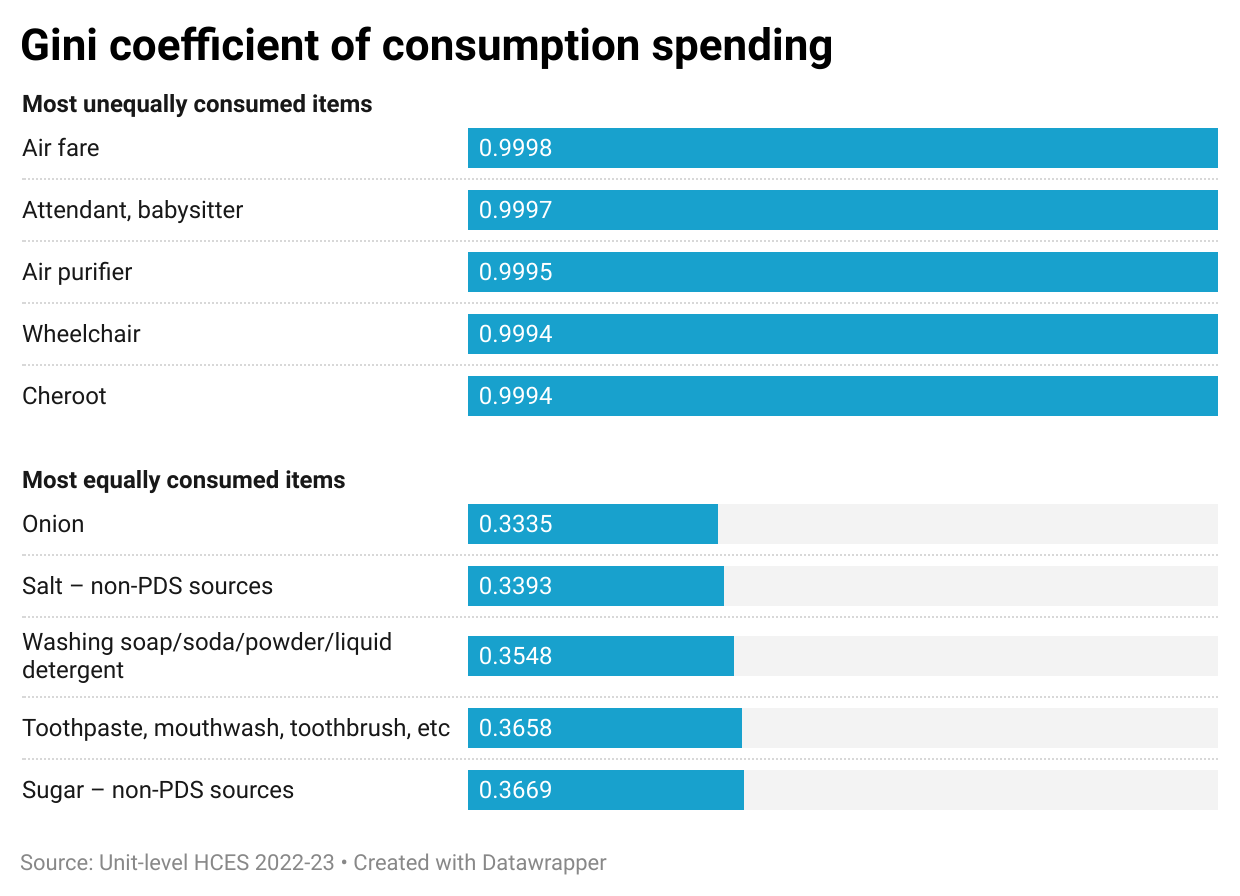
 Onions are the most equally consumed items and air-fare spending is the most unequalThe HCES records consumption spending by 261,746 households on 359 individual goods and services (eight of these 359 are grains, pulses, and other items received free; and some of the items were only surveyed as grouped miscellaneous items). Which of these are consumed most equally and unequally? The most common statistical measure for equality of lack of it in any distribution is what is known as the Gini coefficient. Gini coefficient takes values from 0 to 1 where 0 denotes perfect equality and 1 perfect inequality. To give a simple example, if an economy spent ₹1000 in total on an individual commodity, but the spending was done by just one consumer among a total of ten consumers, Gini would take a value of one. If all ten consumers spent ₹100 each on the item, it would take a value of zero. A comparison of Gini coefficient for the 351 non-free consumption items in the HCES data gives the highest and lowest Gini coefficients for air fares (0.9998) and onions (0.3335). Among the other most equal items by Gini coefficient are salt; washing soaps/soda/powders/liquid detergents; and toothpastes, mouthwash, toothbrushes, etcetera. On the other hand, attendants, babysitters; air purifiers; and wheelchairs involve the most skewed spending in India after air tickets. See Chart 1: Top five and bottom five items by gini coefficient
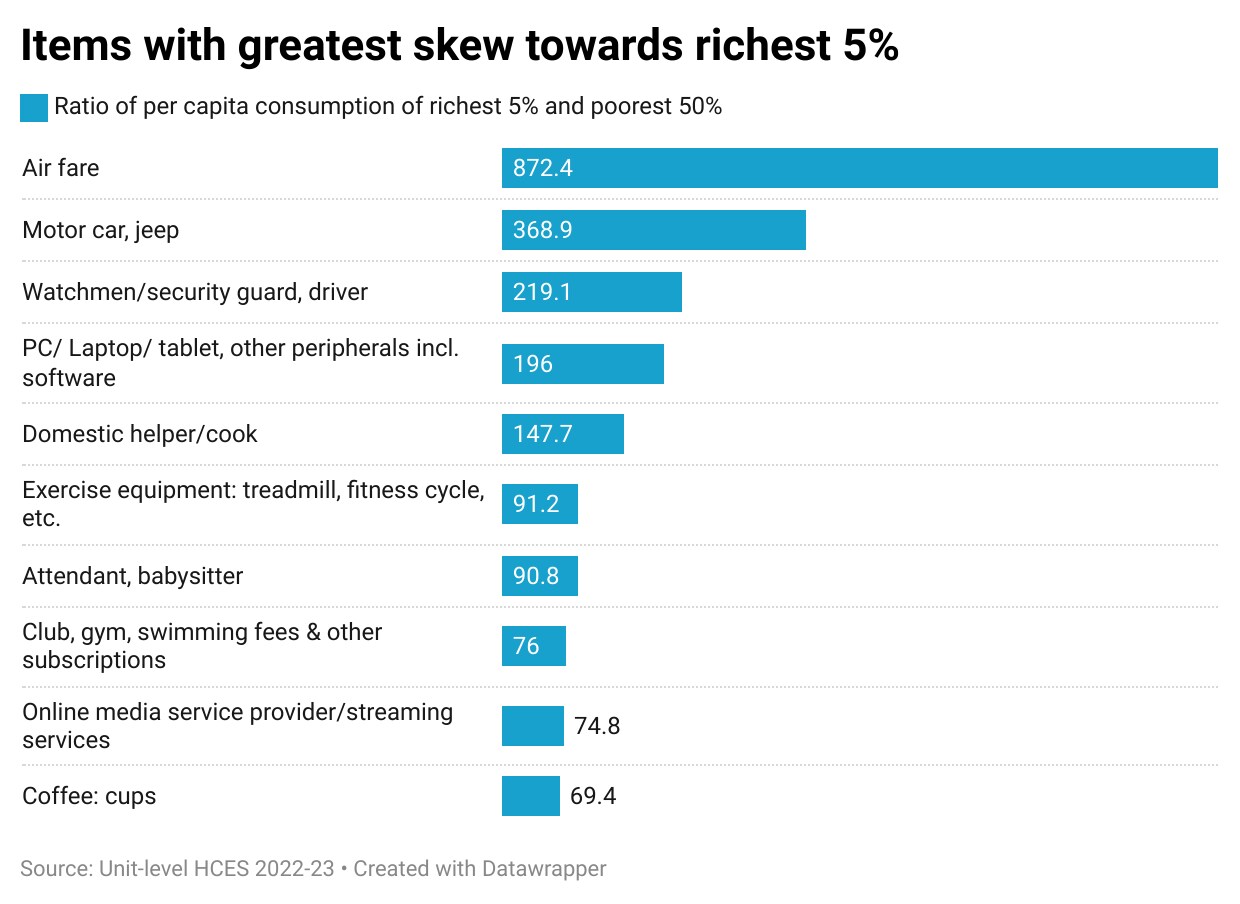
- To be sure, item-wise Gini coefficients can be class agnosticThis is an important thing to keep in mind while reading HCES data. Because the Gini coefficient is only concerned with the skew in consumption of a particular item within a group of consumers, it does not necessarily tell us whether the rich or poor are generating this inequality in case the Gini coefficient is on the higher side. HCES data supports this line of reasoning. Both air-fare and coarse grains from the Public Distribution System (PDS) figure have Gini coefficients that are in the top 10 among 351 goods and services. However, the ratio of spending by the rich (top 5% of HCES by overall consumer spending) and bottom half of the population in spending on air-fares (872.4) is significantly higher than that for coarse grains from the PDS (3.4). This basically means that a high Gini coefficient for a particular item could just mean that the rich do not consume it at all, something economics textbooks refer to as inferior goods. If one were to rank goods and services by the difference between consumption spending of the rich and the poor, air fares and motor cars, jeeps are the most unequally consumed items while the poor spend more than the rich per capita on kerosene and firewood and chips. Intuitively this makes more sense than a Gini-wise ranking to make sense of consumption inequality in Indian economy. See Chart 2: Top ten equally and unequally consumed items
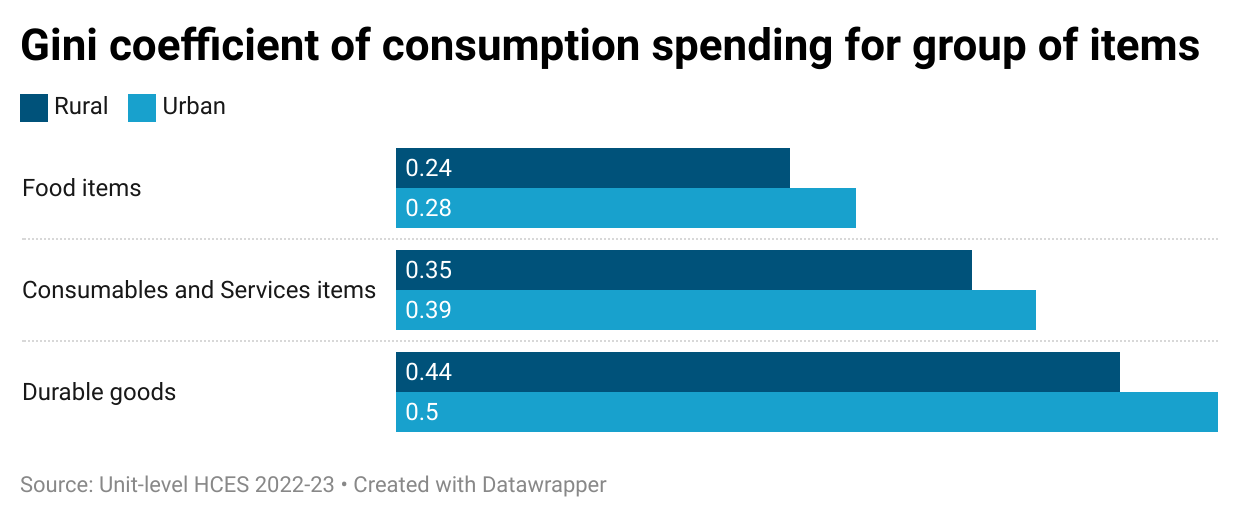
- This is why it makes sense to look at broad categories rather than individual itemsA comparison of broad groups of consumables supports this argument. If one were to classify all 351 items given in the HCES schedule into three broad categories: food, consumables and services, and durable goods, inequality -- whether one is looking at group-wise Gini coefficients or ratio of spending by the top 5% and bottom 50% -- increases from food to durable goods. What is also worth underlining is the fact that urban inequality is higher than rural inequality, particularly for durable goods. Once again, this makes eminent sense. See Chart 3A and 3B: rural-urban group-wise Gini and top 5%-bottom 50% ratio
- To be sure, there is a lot of high value consumption which HCES does not captureThis is the most important thing to keep in mind. NSSO surveys such as HCES do not even capture the really rich (who often describe themselves as middle class) in the country. Numbers speak for themselves. The richest household in terms of monthly per capita expenditure recorded in the 2022-23 HCES spent ₹2.65 lakh per person per month. The highest monthly per capita spending on foreign/refined liquor or wine is ₹12,857 and it does not exceed ₹1,233 for any kind of footwear. So if you have spent more than these amounts on a bottle of whiskey or shoes (many people reading this story would have) consider yourself a statistical outlier in India’s consumer economy. To be sure, one could very well argue that a lot of the shine in India’s consumer economy is thanks to these outliers rather than the broad base.