
 E-Paper



What India wears -1 | Number Theory
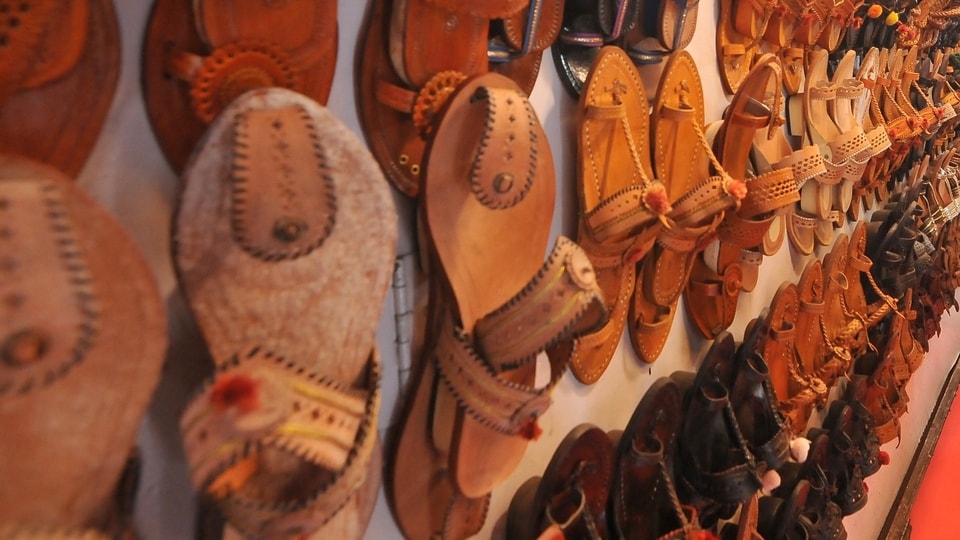
Italian luxury fashion company Prada has announced that it will team up with local artisans in India to produce limited edition Kolhapuri chappals
Updated on: Dec 13, 2025, 12:23:37 IST

 Prefer HTon Google
Share via


Copy link

Italian luxury fashion company Prada has announced that it will team up with local artisans in India to produce limited edition Kolhapuri chappals. These sandals are expected to be priced around $930 or ₹84,000 per pair. The announcement is an interesting opportunity to look into the spending behaviour of an average Indian (more on this later) on clothes and footwear. This two-part series will use data from the latest Household Consumption Expenditure Survey (HCES) in India and look at what kind of clothes and shoes Indians spend their money on and state-wise trends in this spending.
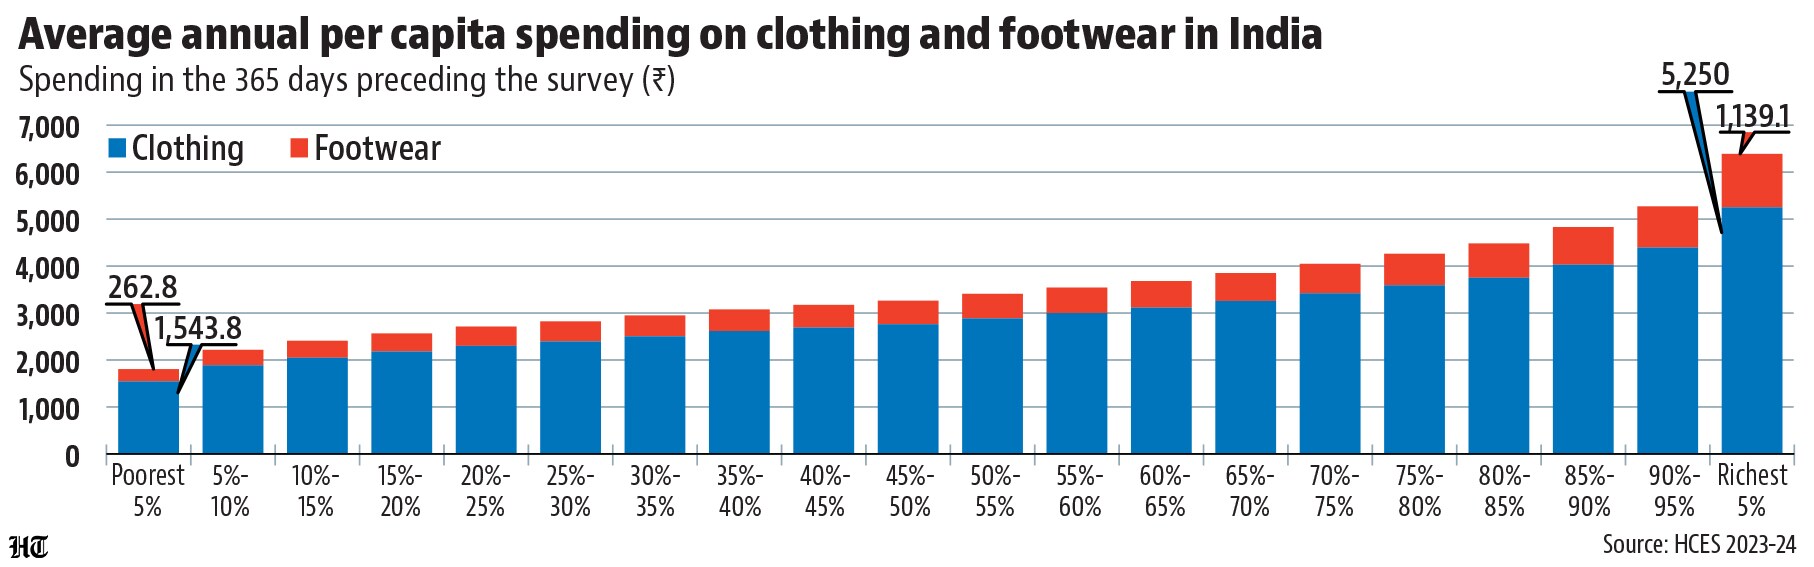
 The price of a Prada Kolhapuri will be 151 times the average annual spending on a footwear in IndiaAccording to the 2023-24 HCES, an average Indian spent ₹557 on footwear and ₹2,982 on clothing in the year preceding the survey. This number was ₹1,139 and ₹5,250 even for the top 5% of Indian households and was ₹35,600 and ₹95,070 for the household that reported the highest per capita spending on these items. But, as has often been underlined in these pages, the HCES is designed in such a way that it undercounts the really rich in India.
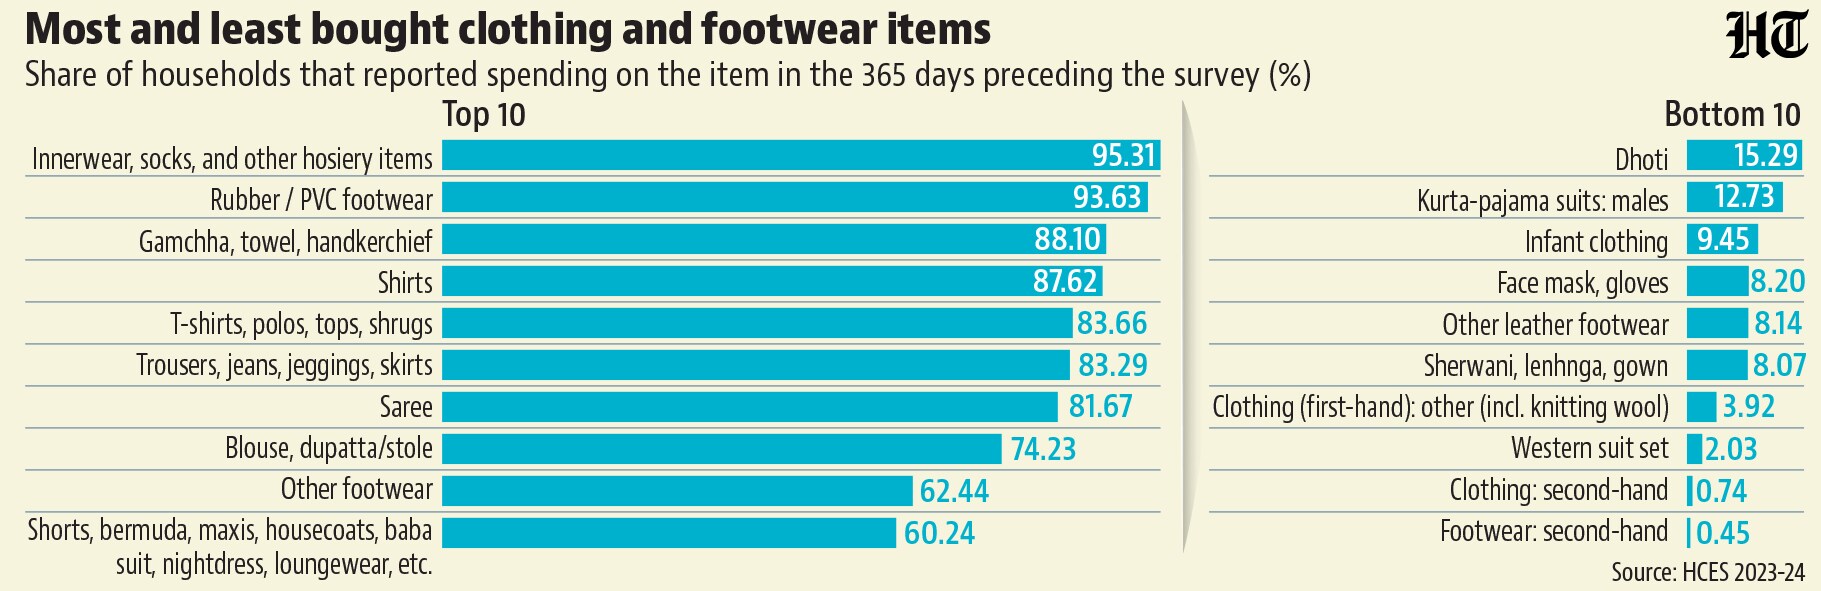
- Innerwear and rubber chappals are the most frequently bought clothing and footwear in IndiaMost people reading this story would be used to buying various pieces of clothing and shoes in a year. HCES data shows that their wardrobe is far more diverse than an average Indian’s. The items of clothing and footwear that come closest to universal buying in the course of the year are the broad category of innerwear and socks and rubber/PVC chappals, with more than 90% households buying something from these categories in the preceding year. Only two in a hundred households bought a western suit and less than one percent bought second hand clothing or footwear.
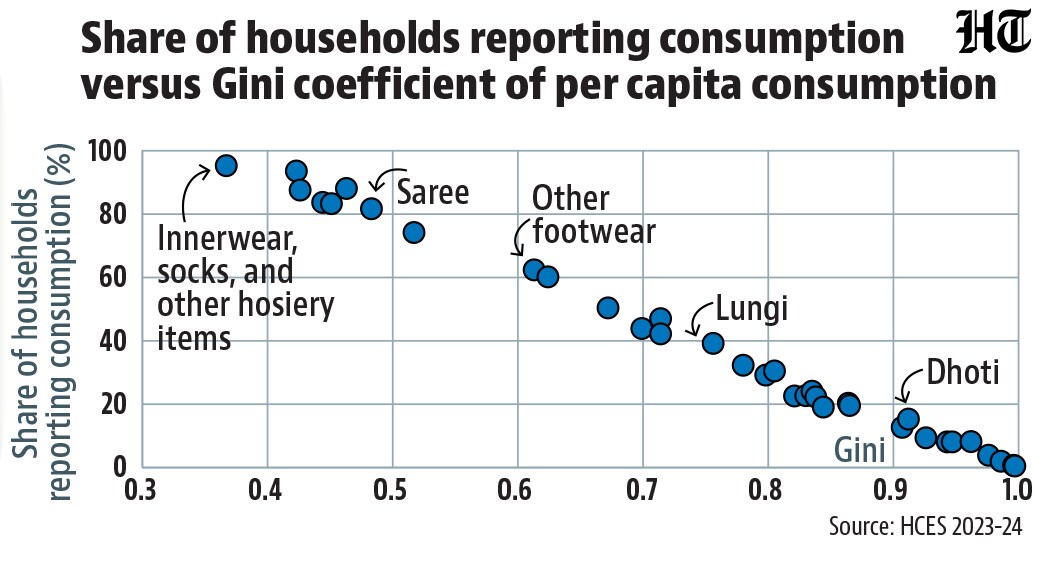
- Most widely bought items also have the lowest inequality in consumptionSome of this is perfectly intuitive. More widely bought clothing or footwear are less likely to have inequality on spending. However, what is equally intuitive is that the equality of use need not have a bought can affect spending more than use. This shows in the HCES data. There is an almost perfect correlation between the Gini coefficient – a statistical measure of inequality where zero represents perfect equality and one perfect inequality – and the share of households reporting consuming an item, but the item-wise Gini is above the level of perfect equality even for the most widely bought items.
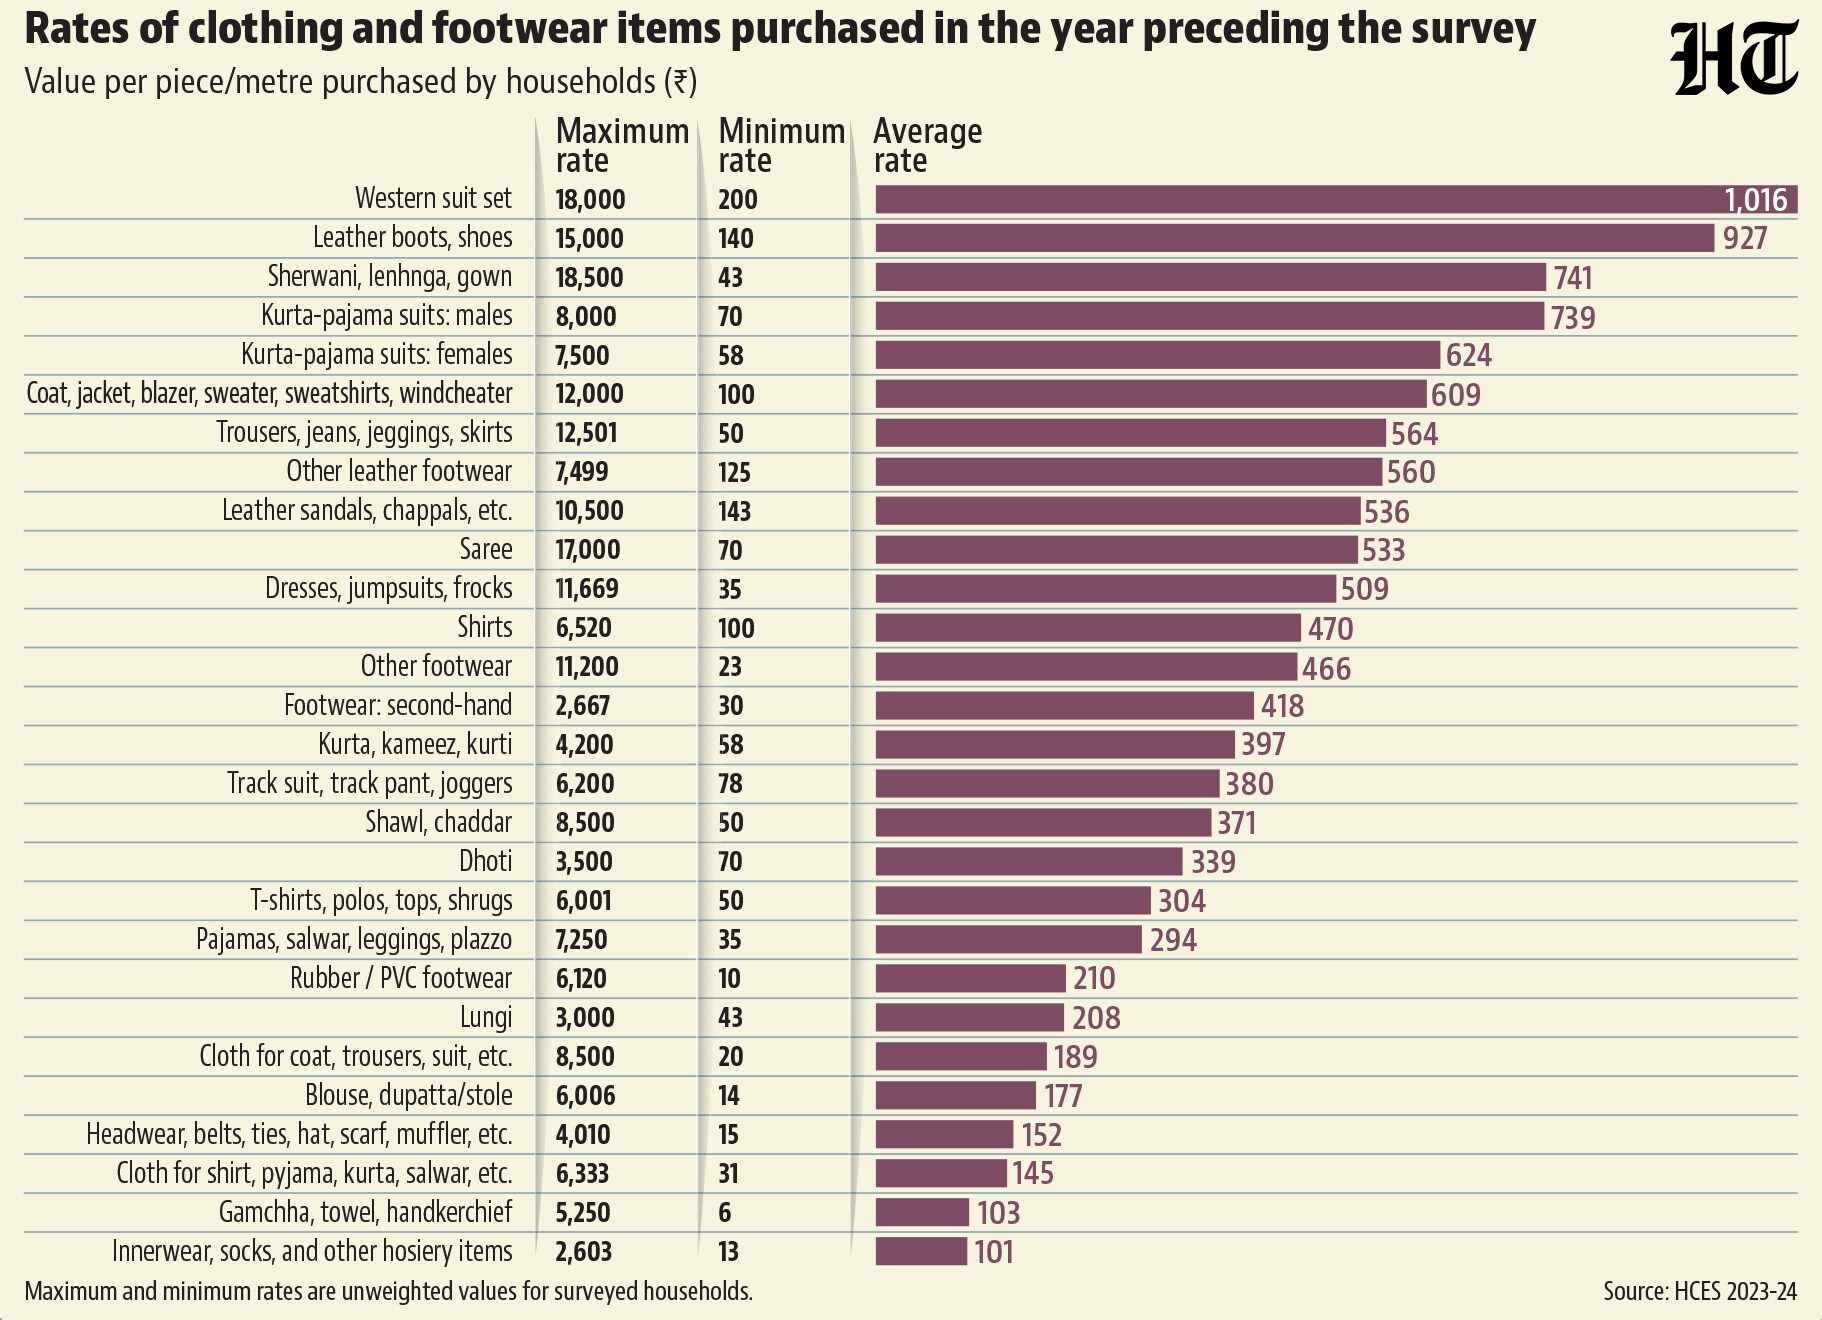
- ₹6- ₹18,500 is the range of spending by households on the price paid per unit for clothing or footwearHow representative are the numbers described above? One way to answer this question is to look at the item-wise spending by rate on a piece of clothing or footwear in the HCES. An HT analysis of unit level data shows that the highest rate for a piece of clothing or footwear was ₹18,500 on a western suit and the lowest was ₹6 for a broad category that includes gamchha, towel or handkerchief. To be sure, the average rates for different pieces of clothing or footwear are much more relatable than the extreme values in the data.



Unlock a world of Benefits with HT! From insightful newsletters to real-time news alerts and a personalized news feed – it's all here, just a click away! -Login Now!


