
 E-Paper



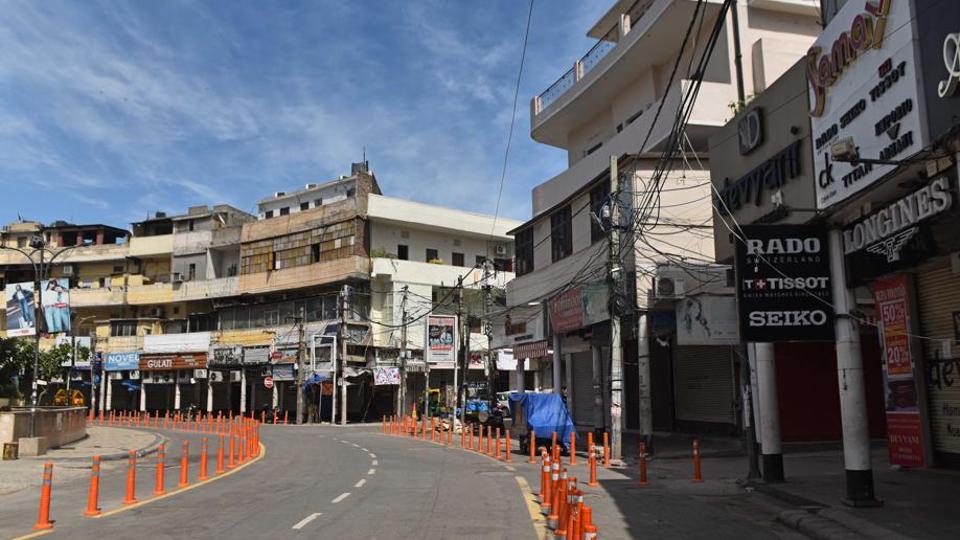
Covid-19 update: How offices, malls have turned sleepy due to lockdown
Google’s ‘Covid-19 Community Mobility Reports’ utilises “aggregated and anonymised” data from Google Maps or other Google-based mobile devices from people who have opted to share their location history.


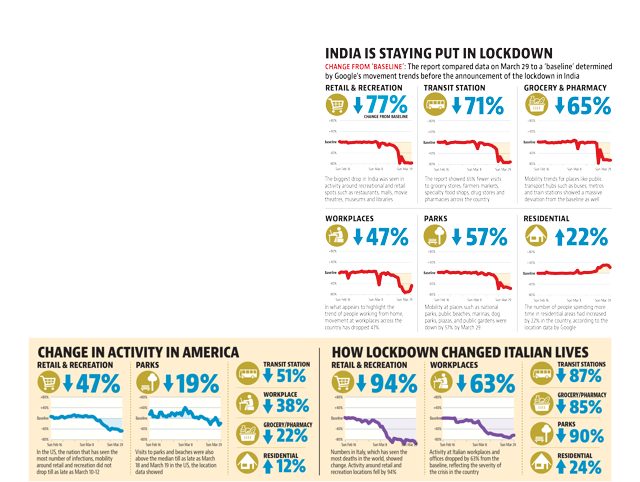
Indians have reduced visits to recreational and retail spots such as restaurants, malls and movie theatres by 77% following the lockdown over the Covid-19 pandemic, movement at mass transit stations has dropped 71% while movement in places of residence has increased by 22%, according to an analysis of location data published by internet search giant Google on Friday.
Google’s ‘Covid-19 Community Mobility Reports’ utilises “aggregated and anonymised” data from Google Maps or other Google-based mobile devices from people who have opted to share their location history. Google said it helps the firm illustrate how busy certain types of locations are, giving an idea about the degree to which people in 131 countries are following government lockdowns.
Click here for the complete coverage of the Covid-19 pandemic
With a countrywide lockdown in place since March 25, India showed massive changes in mobility trends. The report showed a 65% decline in visits to grocery and pharmacy stores, while movement at public parks, gardens and beaches reduced by 57%. In what appears to highlight the trend of people working from home, movement at workplaces across the country has dropped 47%, according to the data.
Google said it hopes that the reports will help governments across the world manage the lockdowns and help fight the pandemic.
“In addition to other resources public health officials might have, we hope these reports will help support decisions about how to manage the COVID-19 pandemic,” Karen DeSalvo, chief health officer of Google Health wrote in a blog post. “These Community Mobility Reports aim to provide insights into what has changed in response to policies aimed at combating COVID-19.”
This information will help governments “understand changes in essential trips that can shape recommendations on business hours or inform delivery service offerings” during the lockdown enforced in various countries across the globe in light of the virus outbreak, she said.
Also Read: Amid Covid-19 crisis, Indian firms hope for quick payments of dues by Govt
Google said the report relies on a “baseline” that was determined by movement trends before the announcement of lockdowns. The first set of data published in the report is till March 29, and compares the movement to the “baseline” of corresponding days between January 3 and February 6, 2020.
“We’ll show trends over several weeks, with the most recent information representing 48-to-72 hours prior. While we display a percentage point increase or decrease in visits, we do not share the absolute number of visits,” DeSalvo wrote.
The company said it relies on a similar analysis in its Google Maps to show how busy certain types of places are, which in turn helps “identify when a local business tends to be the most crowded”.
Meanwhile, in the United States, the country that has seen the most number of infections — over 265,000 people -- retail and recreation trips dropped 47%, grocery and pharmacy visits dropped 22%, and workplace visits fell 38%. Interestingly, the data showed that mobility around retail and recreation in the US did not drop till as late as March 10-12. Visits to parks and beaches were also above the median till as late as March 18-19 in America.
In Italy, the country that has seen the highest number of deaths -- 14,681 -- from the virus in the world, movement around retail and recreation centres dropped by 94%. Grocery and pharmacy visits were down 85%, and workplace trips fell 63%. Italy has imposed severe limits on movement and shuttered all non-essential services until April 13.
There was no data available for China or Iran, where the number of total infected people, including the dead, crossed 132,000 together.
(With inputs from agencies)


