E-Paper



Number Theory: India's consumption spending numbers explained in 4 charts
The slowest growth in average consumption spending was seen between the 1999-2000 and 2004-05 Consumption Expenditure Survey rounds.
Published on: Feb 26, 2024, 08:25:11 IST


Share via


Copy link

The National Sample Survey Office (NSSO) has published the summary results of Household Consumption Expenditure Survey (HCES) for 2022-23 on February 24. The publication of HCES results marks the end of an eleven year drought on official consumption data in India. Because the NSSO has not published the full report or unit-level data of the HCES, a detailed statistical analysis of the results is not possible. With this caveat in place, here are four key takeaways from the HCES data.
India's consumption spending numbers explained in 4 charts
 What has happened to real consumption spending growth?This is the most important long-term trend which one will look for in the latest HCES data. While the current government junked the 2017-18 Consumption Expenditure Survey (CES) in November 2019 on the grounds of poor data quality, leaked findings of the report suggested that average consumption spending had fallen in real terms compared to the 2011-12 CES. Using Consumer Price Index (CPI) data to deflate 2011-12 and 2022-23 average consumption spending numbers shows that average consumption has increased rather than fallen in real terms during this period. However, a slightly long-term comparison of compound annual growth rate (CAGR) of average consumption spending values from 1999-2000 CES to 2022-23 HCES shows that the period between 2011-12 and 2022-23 has seen the second slowest rate of growth in average real consumption spending in both rural and urban areas. The slowest growth in average consumption spending was seen between the 1999-2000 and 2004-05 CES rounds which largely coincided with the term of the first National Democratic Alliance (NDA) government under Atal Bihari Vajpayee. While a headline comparison of the CAGR of real consumption spending might tempt one to argue that this has been a lost decade of sorts for consumption growth in India, it needs to be read with the context of the pandemic’s economic disruption wiping off growth in 2020-21 and even 2021-22. Private Final Consumption Expenditure (PFCE) has been one of the slowest to recover from the pandemic’s impact in India.
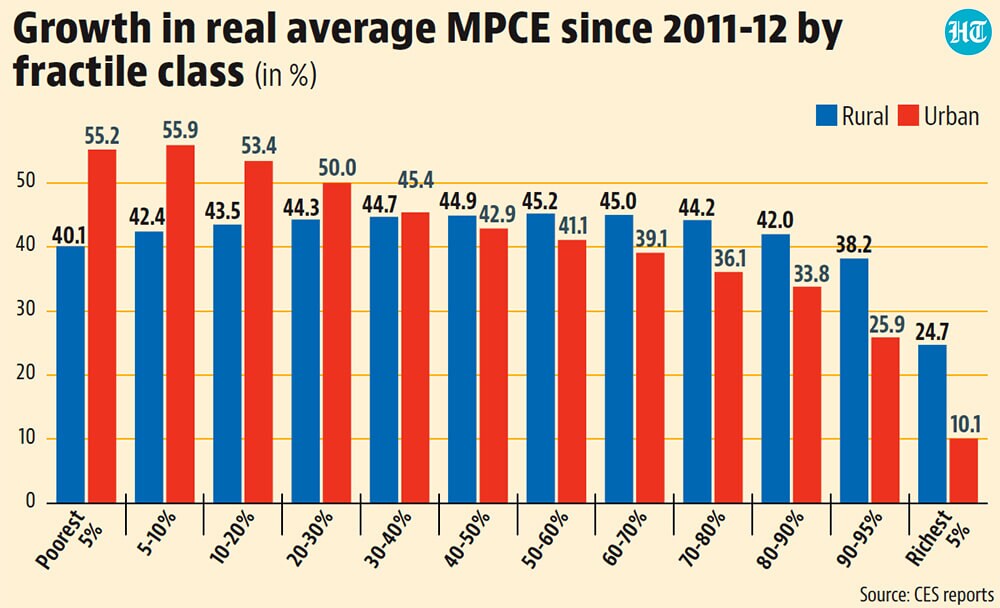
- What has happened to consumption spending inequality?A definite answer to this question will require access to unit-level data or at least the publication of Gini Coefficient in the full report of the HCES and its comparison with previous CES reports. To be sure, even such comparisons might not be foolproof because of a change in methodology of data collection in the HCES compared to previous CES, as was explained in these pages yesterday. With this caveat in place, one can do a very elementary exercise to look at consumption spending growth across the class divide by comparing proportional growth in average spending for all fractile classes between the 2011-12 and 2022-23 surveys. The data shows that the growth has been lower for the richest classes compared to the ones towards the bottom of the pyramid. Whether this means a bigger improvement in economic fortunes of the poorer segments or the rich diverting their incomes towards savings rather than consumption or build-up of pent-up demand by the rich (there is some anecdotal evidence for this) is a question which can only be answered with more data such as one from the debt and investment surveys of the NSSO.
- Spending on services is perhaps more than food at the all-India level nowSpending on services components of just non-food items (even food consumed outside will amount to a part of the service business) is 24.2% and 27.8% in rural and urban areas respectively in the 2022-23 HCES. This means that it is extremely likely that total consumption spending on services is now similar to what Indian households spend on food as a whole even in rural areas. While the trend of growing share of services in total household spending has been consistent, the fact that it has possibly overtaken food spending in the country is an extremely important milestone for the Indian economy. One will have to wait for the class-disaggregation of MPCE data to see whether this change is being driven by just the rich or all segments of the population.