E-Paper



Number Theory: Sea surface temperatures may break another record on March 28
.

 Prefer HTon Google


At least three temperature datasets – those produced by Berkeley Earth, NASA, and the Copernicus Climate Change Service (C3S) -- have shown that the 12-month running mean of global temperature breached the 1.5°C warming threshold for the first time at some point in the past year. While this does not mean that the Paris Agreement’s goal of keeping global warming within 1.5°C (over pre-industrial levels) has been breached, the past year is definitely a big leap towards that. If that were not bad enough for global climate, the world is on the cusp of another temperature milestone on March 28. It is almost certain that by March 28, the world’s daily sea surface temperature (SST) would have stayed the warmest (compared to the same day in other years) for 364 of the past 365 days. Here are three charts that describe how unprecedented SST warming was in the past year and how that happened.

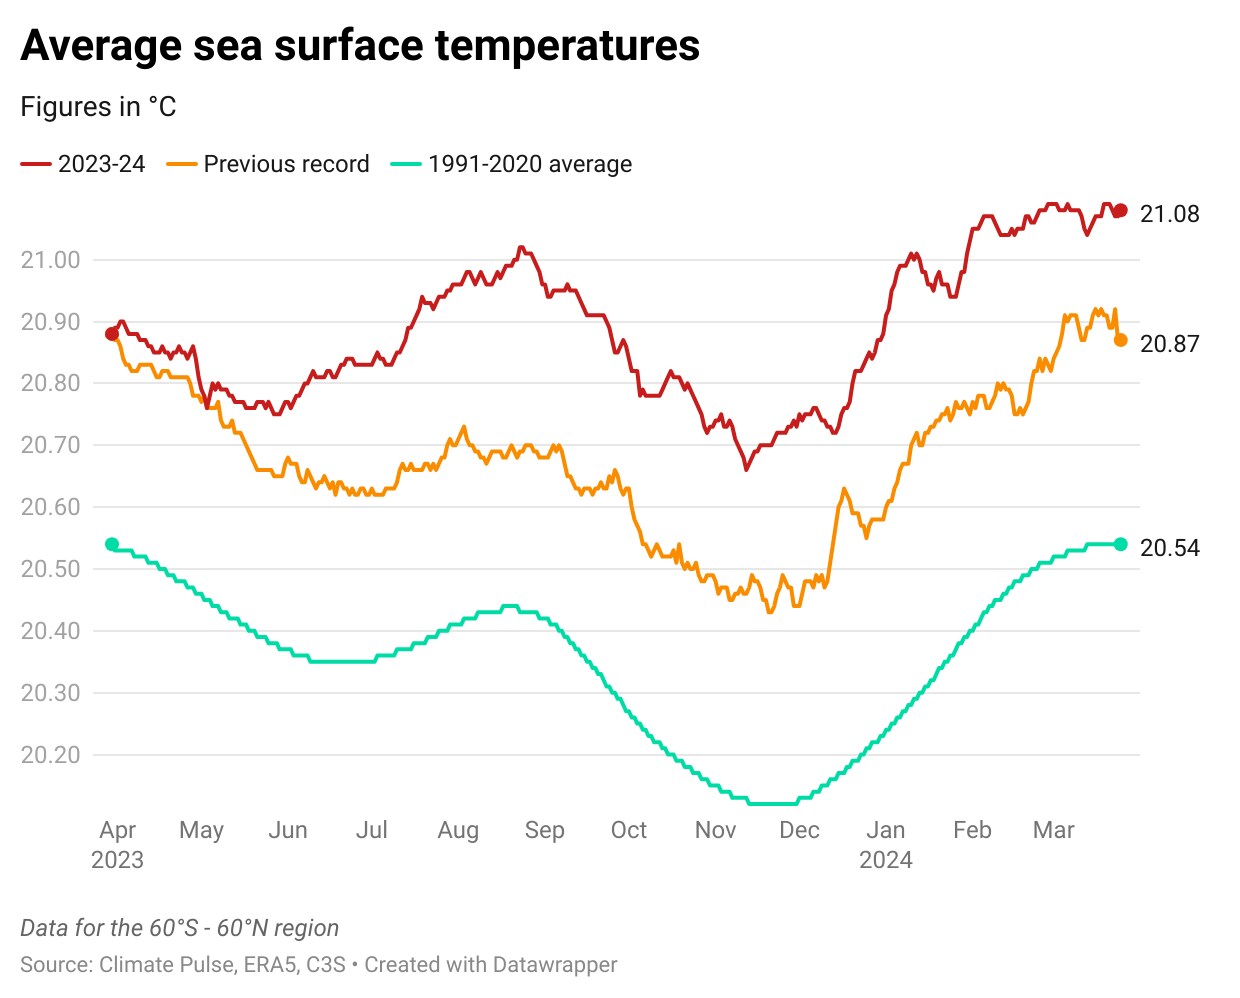
 Daily SST has been the warmest ever on every day from March 30, 2023 except on May 3, 2023It is important to track sea surface temperature (SST) because it is harder to warm or cool water than air. This makes SSTs a more definite indicator of global warming than air temperatures, which are the most commonly reported temperatures. And SSTs have shown even more remarkable trends that air temperatures in the past year. Daily SSTs are available from the Climate Pulse dashboard of C3S from January 1, 1979. This shows that on every day starting March 30, 2023 (except May 3, 2023), the world’s average SST was the highest for that day up to March 25, 2024, the latest day for which data is available. To be sure, the average SST on May 3, 2023 was the second highest SST for May 3. Such unprecedented warming on a daily basis was not seen in air temperatures in the past year. The data up to March 25, 2024 suggests that the daily SST during March 26-March 28 period will also be the highest for those days. One reason for this is that SSTs will have to cool at an unprecedented rate in this three-day period to not break previous records. They will have to decrease at least 0.13°C compared to the SST on March 25. The most SSTs have varied from one day to the next in the ERA5 data is 0.07°C. The trends in SSTs seen in the past six months are the second reason why one can expect SSTs to remain at historically high levels in the near future. Daily SSTs since October 1 have been at least 0.13°C above the previous record for the day.
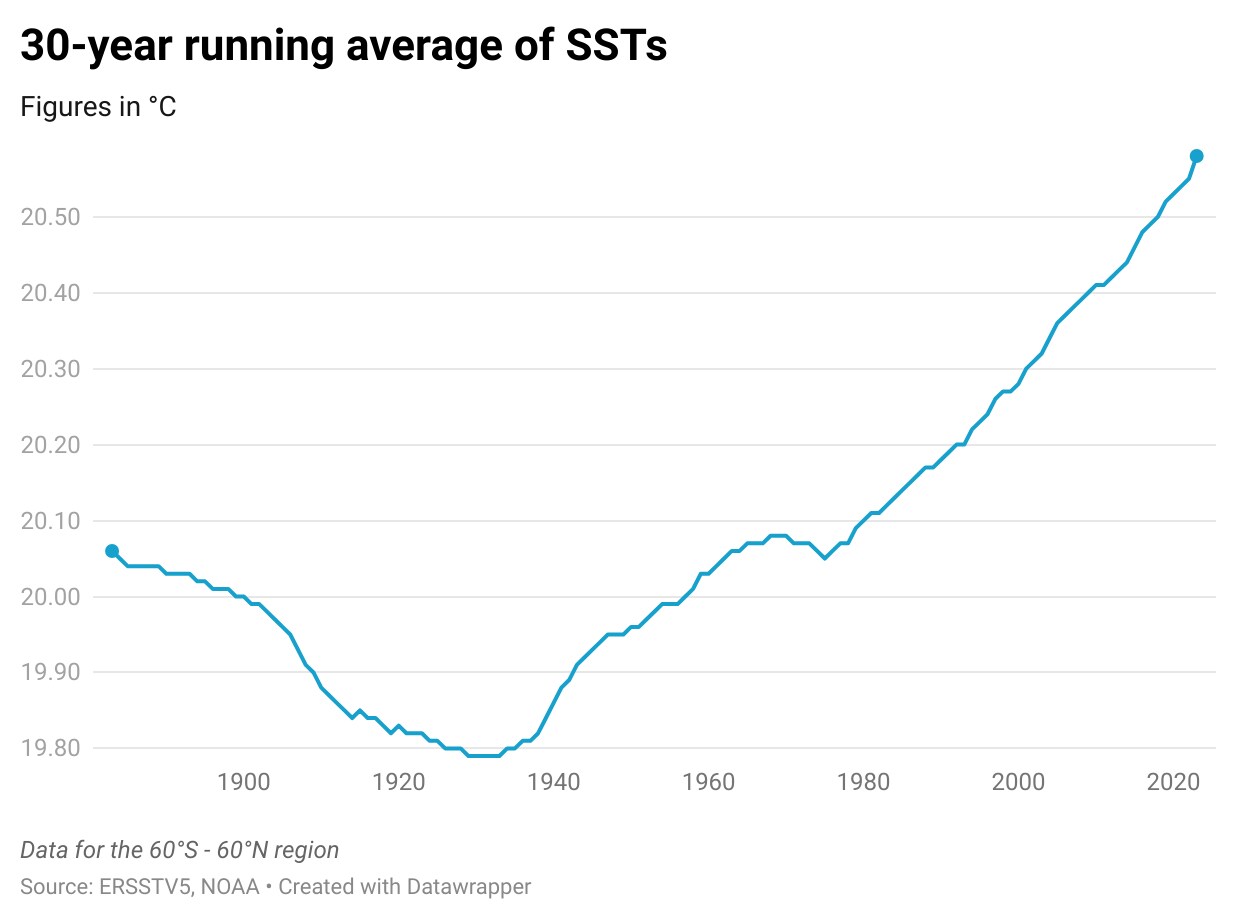
- Part of the reason for high SSTs is cyclical and part of the reason is long-termOne reason for the unprecedented SSTs in the past year is cyclical: the periodic warming (called El Nino) and cooling (called La Nina) of the equatorial Pacific Ocean. An El Nino has been underway since June last year, and the Oceanic Nino Index (ONI) for the Nino 3.4 region (5°N-5°S, 120°-170°W) used to track this cycle was rising up to late last year. Warming in SSTs in the past year moved largely in tandem with this index. However, this cyclical factor is only a part of the story. SSTs have also been rising long-term since the early 20th century, a result of human-induced global warming. Without this long-term warming, the El Nino cycle would not have been able to push SSTs to the level seen in the past year.
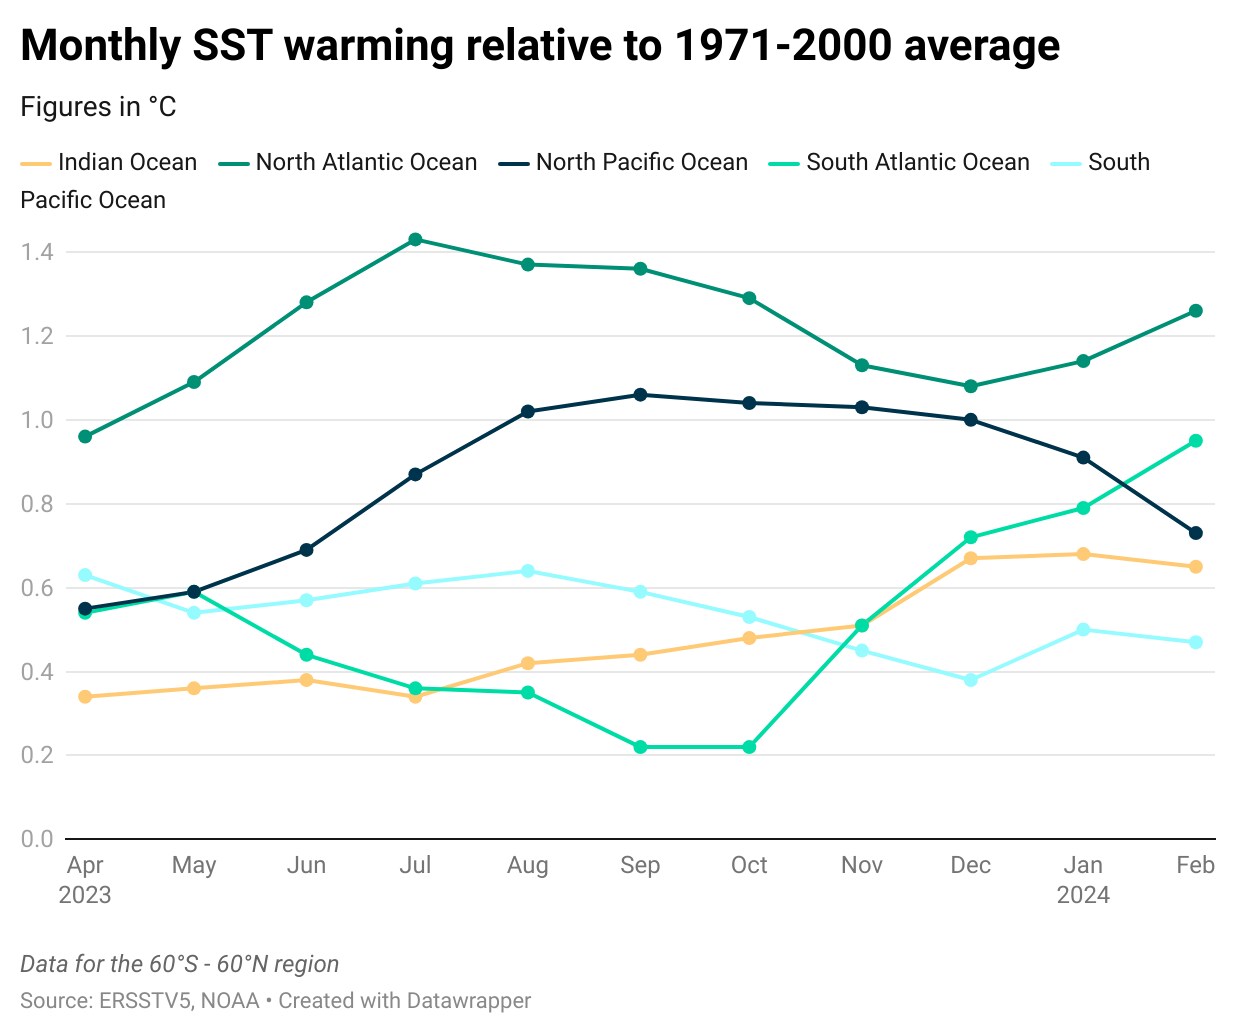
- However, there can be other reasons for the big spike seen in the last yearSince El Nino is responsible for part of the SST warming seen in the past year, it is natural to expect that the warming in the Pacific Ocean will be more than in other oceans. However, that is not the case. The warming in the North Atlantic Ocean has been more than in both the North and South Pacific Ocean every month in the past year. Moreover, among the five big oceanic regions analysed here – the northern and southern halves of the Atlantic and Pacific Oceans and the Indian Ocean – only the North Atlantic Ocean has broken month-wise records in every month of the past year. In fact, the warming in the North Atlantic Ocean was even more than in the Nino 3.4 region in June and July 2023, the first two months of the current El Nino cycle. Why did the North Atlantic Ocean warm up more than other oceans? In June 2023, some scientists suggested that the lack of Saharan dust in the northern hemisphere spring – it has a cooling effect on the Atlantic Ocean – could be one reason. Another reason suggested by scientists is a restriction imposed on sulphur in marine fuels in 2020 by the International Maritime Organisation. Since sulphur-based emissions have a local cooling effect and the North Atlantic is a busy maritime route, a decline in such emissions is likely to have added warming on top of long-term and cyclical warming. To be sure, these reasons only explain why SSTs have broken previous records by a huge margin. As explained in the previous section, the reason why SSTs are increasing long-term is global warming.