E-Paper



Number theory: Understanding the political economy of free electricity
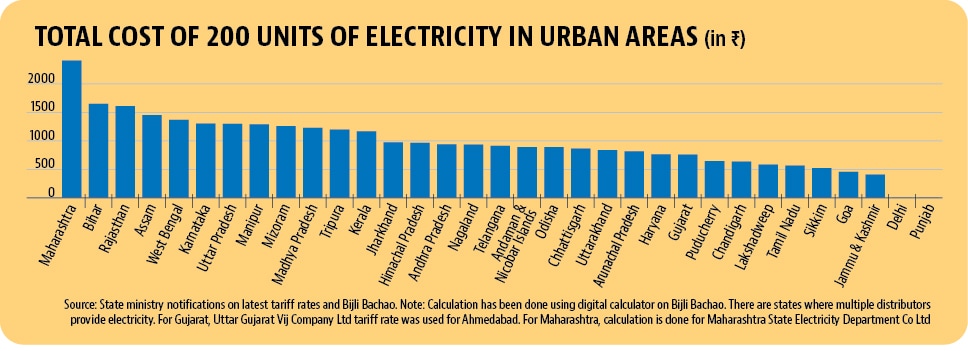
An HT analysis of data on domestic urban power tariffs for various states and Union territories (UTS) shows that these vary significantly across states.
Updated on: Jun 19, 2023, 12:27:39 IST

 Prefer HTon Google
Share via


Copy link

The charts that matter
 Karnataka and Rajasthan had among the highest power tariffs...An HT analysis of data on domestic urban power tariffs for various states and Union territories (UTS) shows that these vary significantly across states. While Karnataka had the sixth highest rate, Rajasthan had the third highest tariff rate for 200 units of electricity in 2023. Another way to look at the burden of electricity bills on voters is to look at it as a share of monthly per capita GSDP in nominal prices. This number for Karnataka was the 10th highest while Rajasthan stands at the fifth highest position among the 21 states for which both monthly state tariff data and per capita state domestic product data for 2021-22 are available. What explains such a large variation in power tariffs across states? Ashwini Swain, fellow at the Centre for Policy Research, lists three major factors - availability of coal in the state (central and eastern regions of the country have an advantage here), cost of transport- ing fuel, and life cycle of existing power plants.
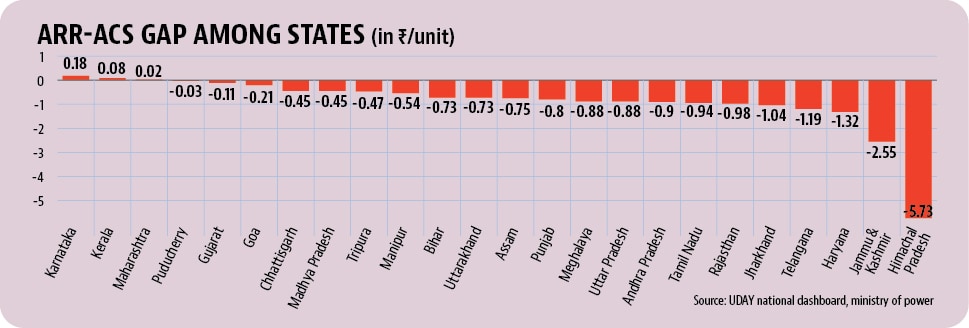
- But Karnataka's power distribution is also the most profitable in the countryAs is to be expected, the pricing of power plays a crucial role in the profitability, or lack of it, of power distribution within states. Analysis of data from the Union power minister's UDAY portal shows that Karnataka was the best performer on this count in 2022-23, with its average revenue realisation and average cost of supply (ARR-ACS) gap being the highest among all states and UTs. Unless the new state government compensates power distribution companies for the cheaper electricity it has promised to provide, Karnataka is bound to witness a worsening of the fiscal health of its power sector, which will ultimately become a strain on state finances. This logic holds for all other states promising free power as well. There are no free lunches here.
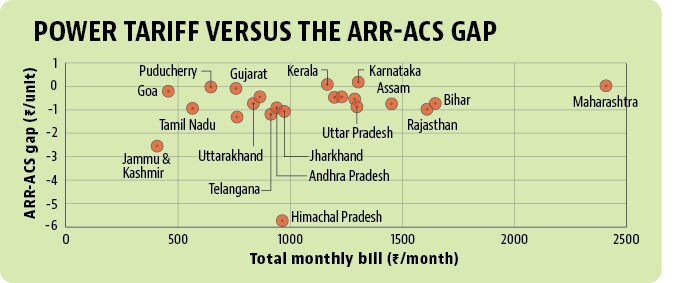
- To be sure, higher power tariffs do not guarantee profitability of power distributionA simple comparison of power tariffs and the ARR-ACS gap across states makes it clear that there is no significant correlation between power tariffs and the fiscal health of the power sector across states. While Karnataka and Maharashtra have profitable power distribution and higher power tariffs, states such as Bihar, Rajasthan and Assam had loss-making power sectors despite high tariffs. Rajasthan ranked in 20th position in terms of profitability among the 25 states for which data is available.
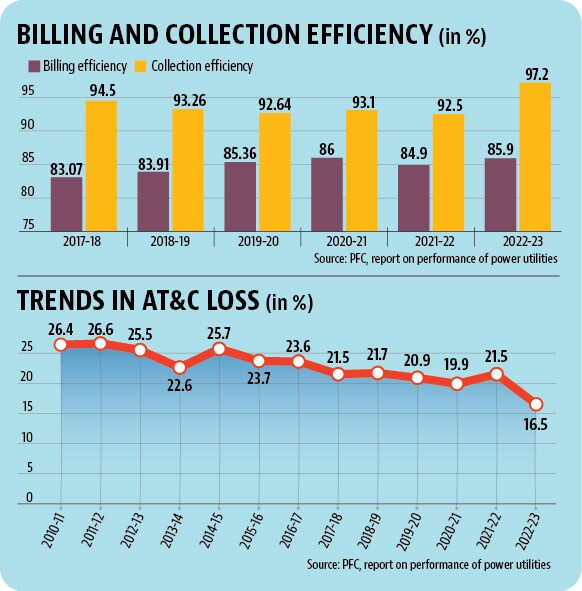
- This is why it is important to understand the reasons for power sector lossesThe profitability or lack of it of a power distribu- tion company (discom) is dependent on multiple factors. Let us look at them one by one. Billing efficiency is the share of energy that has been billed to consumers in total energy which has been supplied to an area. This number will be lower for an area which has a problem with power theft which leads to unmetered consumption of electricity. Collection efficiency is an indicator of the proportion of the amount that has been collected from consumers with respect to the amount billed to them. This number will be lower if consumers do not pay their power bills. While collection efficiency has increased significantly over the years, billing efficiency continues to lag, emerging as a major source of discom losses. Discom losses are also rooted in factors other than billing and collection efficiency. This is why it is important to look at the aggregate technical and commercial loss (AT&C Loss) metric for discoms. AT&C Loss is a combination of energy loss (technical loss, billing inefficiency, theft during the transmission etc.) and commercial loss (collection insufficiency and default in payment). During the last decade, India has shown a considerable reduction in AT&C Losses. AT&C Losses improved to 16.5% in FY22, almost 5 percentage points lower than FY21 and 3 percentage points lower than FY20 levels. However, it still remains below the desired range of 12-15%.