E-Paper



The rise and rise of white-collar salaried aristocracy in India
An HT analysis shows that the real economic winner over the last decade has been the white-collar salaried workforce

 Prefer HTon Google


There were around 76,000 more so-called crorepatis (those earning over ₹1 crore) by income tax returns in 2022-23 when compared to 2021-22. When seen in conjunction with the fact that the number of those with incomes up to ₹5 lakh (again, by returns) has stayed almost flat, there’s a strong suggestion of a skewed growth in incomes.

But even more illuminating is the publication of Income Tax Return (ITR) data – this includes both income tax and corporation tax filings – for assessment year (AY) 2019-20, 2020-21 and 2021-22 recently. AY 2021-22 captures incomes in fiscal year 2020-21. The earliest period for which we have this data is AY 2012-13.
The data can help us understand the transformation in India’s political economy. That this has transformed since the 1991 economic reforms is now a cliché. Three decades is too long a time interval to be treated as a monolithic block. The Indian economy has seen multiple disruptions such as the Global Financial Crisis of 2008, the subsequent macro-economic fragility in the early 2010s and the formalisation push which was unleashed by the Narendra Modi government since 2016.
The data is all the more important because we do not have a consumption expenditure survey, economic census, decennial census or survey of informal sector enterprises in the last few years.
And sure enough, its analysis has been rewarding: An HT analysis shows that the real economic winner over the last decade has been the white-collar salaried workforce. Here are some charts which explain this argument in detail.
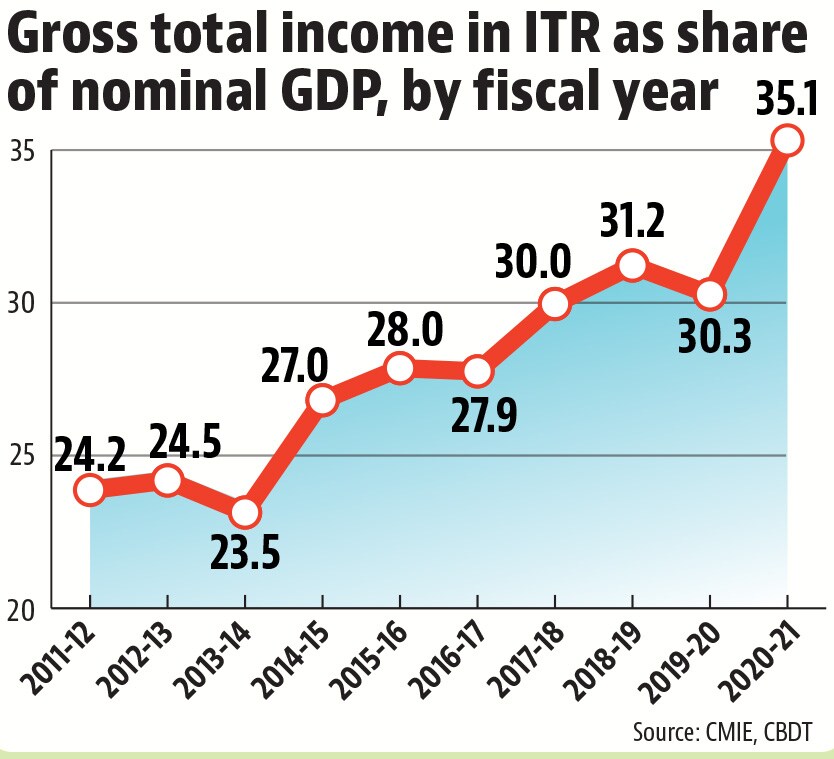
 The formalisation story is true, but it started before demonetisationThe best way to test the claim whether the Indian economy has become more formalised between 2011-12 and 2020-21 is the look at the share of gross total incomes as reported in ITR filings in nominal GDP. This number was 24.2% in 2011-12 and increased to 35.1% in 2020-21. Lack of public ITR data on gross total income for the period before 2011-12 (AY 2012-13) is a problem, but a ten-percentage point increase in a decade is not an insignificant development at all. Did demonetisation in 2016 lead to this? Perhaps not. Data shows that the share was already increasing before demonetisation and it has continued to increase in the period after that.
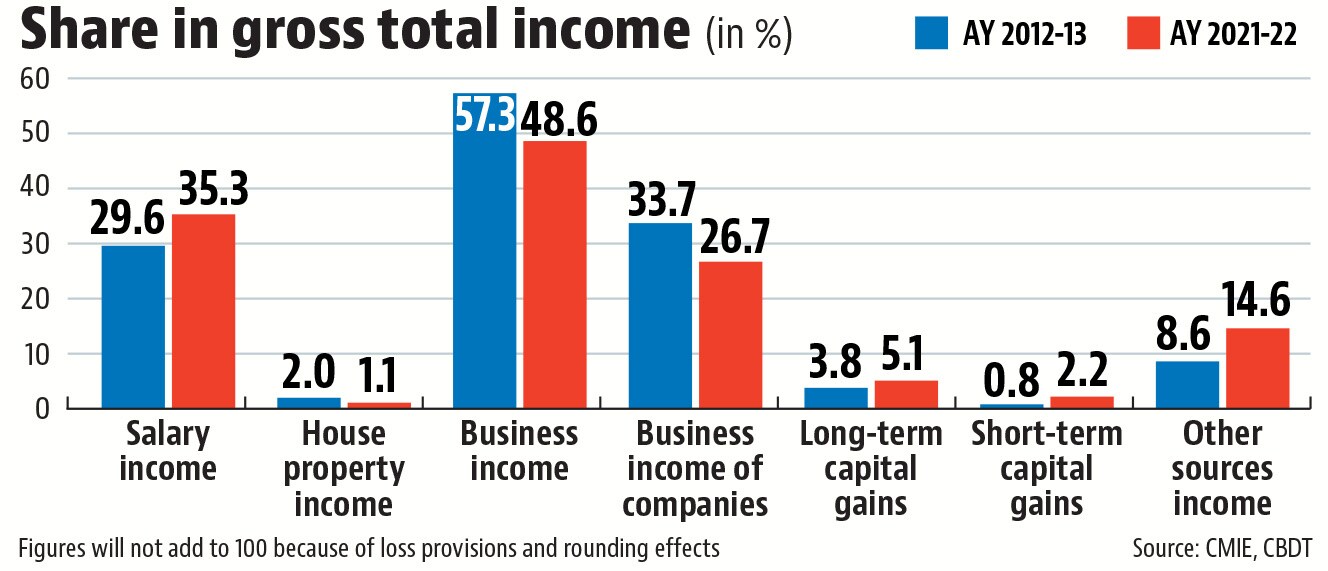
- Salary income share has increased while business incomes have seen a fallITR data classifies total returned income into salary income, house ownership income, business income, capital gains (long-term and short-term) and other sources. Business incomes are a good proxy for profit income to business owners. A comparison of these shares in AY 2012-13 and AY 2021-22 shows that the share of salary incomes in gross total incomes has increased while that of business incomes has fallen. To be sure, the latter is still more than the former and, put together, the two account for more than 80% of gross total incomes. If one were to look at business incomes to companies – this will include what is typically referred to as the corporate sector – this share has fallen as well. In fact, a long-term comparison shows that salary incomes have already overtaken business incomes for companies and are closing the gap with overall business incomes as well.
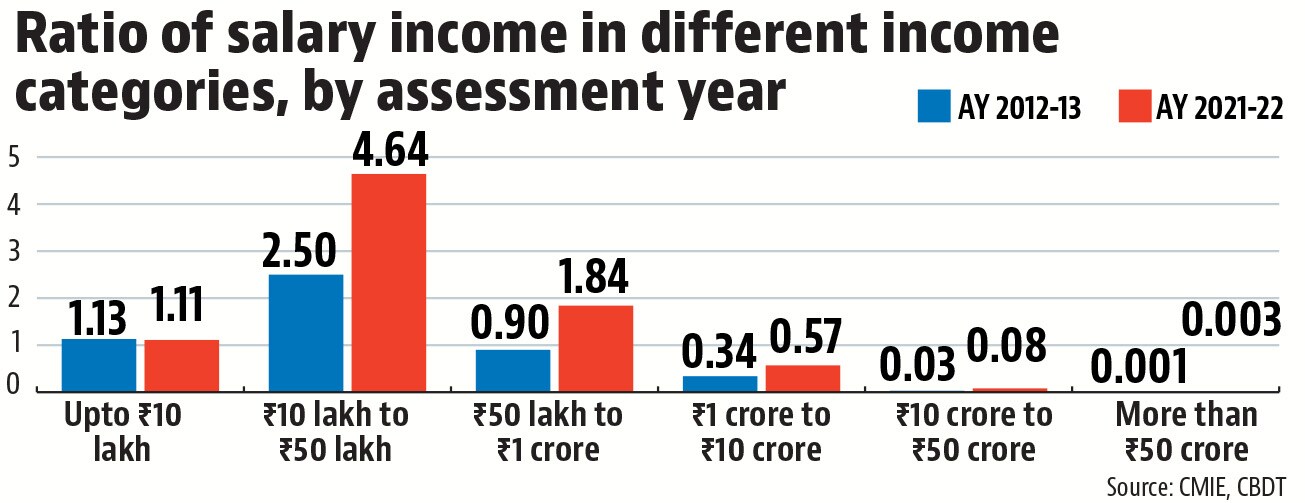
- Salary earners in the ₹10 lakh- ₹1 crore bracket now earn much more than their businessmen counterpartsITR data allows us to compare total incomes from salary and business for various income categories. A comparison of AY 2013-13 and 2021-22 numbers shows that salary earners now earn much more than their businessmen counterparts in incomes up to ₹1 crore per annum. Even in the ₹1- ₹10 crore income category the ratio of salary and business incomes has increased from 0.34 in AY 2012-13 to 0.57 in AY 2021-22. One has to be a businessman earning more than 10 crores per year to be a “class apart” from well-paid managers. There are very few of them. Number of business income ITRs with an annual income of more than ₹10 crore was less than 15,000 in AY 2021-22. Meanwhile, salary incomes as a share of business income have seen a steady rise till AY 2018-19, then dropping slightly. They have gone from 51.6 in AY 2012-13, to 82.2 in AY 2018-19, finally settling at 72.6 in AY 2021-22.
- The political economy of these numbersUnless one is a really rich businessman, and there are very few of them in India, it probably makes more sense to aspire to be in the elite salaried workforce than try and be an entrepreneur in India. For a country which is trying to boost its manufacturing, especially the medium and small enterprise component of it, this is not exactly good news on the incentives front. While it is difficult to prove this conclusively, it can be said that the low-interest regime aided venture capitalist (VC) funded start-up boom which began in the early 2010s must have played a direct (start-up bureaucracies very well paid) and indirect (other companies being forced to pay higher salaries) role in the rise of the high-end salaried class. Will this trend continue in the future? A prediction is always difficult, but the fortunes of this elite salaried class are the most linked to global capital’s take on the India story. Unless more VC money (developed country interest rates will matter here) and big MNCs keep coming to India, the market for elite managers will not see the same boom it has seen in the last decade.