E-Paper



Number Theory: Has heat tread the heels of polling this election?
The average polling day maximum for the sixth phase parliamentary constituencies is 44.5°C compared to the national average of 39.3°C.

 Prefer HTon Google


The seven-phase 2024 Lok Sabha elections, which started on April 19 and will end on June 1, is in the middle of India’s summer season. The usual trend of India’s average maximum – as seen in the 1981-2010 average considered the “normal” – is that it rises almost continuously from April 19 to May 26, and begins to fall rapidly off that level after June 4.
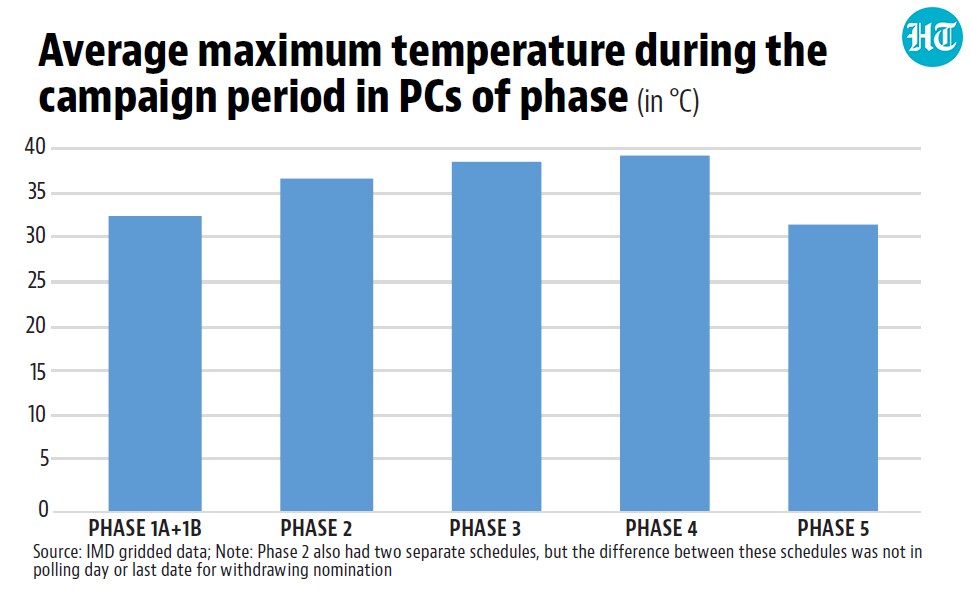
Does this mean that each of the five phases of the election held so far were hotter than the previous one? An HT analysis confirms that this is largely true. However, this analysis also shows a more counter-intuitive trend: the heat followed polling in these elections. In other words, the area where polls were taking place generally experienced a higher maximum temperature than in the regions where there was no polling during this period. And, on average, the maximum was also largely warmer than normal in the polling region while it was cooler than normal elsewhere.
 The average maximum during the campaign period became hotter up to the fourth phase, but cooled in the fifth phaseFor this analysis, the campaign period was considered as the period starting from the last day for withdrawal of nominations to the day of polls. It shows that the average maximum of the region going to polls was higher (during the campaign period) in each successive phase up to the fourth phase, but dropped in the fifth phase. This is expected since the campaign period of each successive phase was in a progressively hotter part of the summer. The trend can also be seen in the distribution of parliamentary constituencies (PCs) by the average maximum recorded in them. No PC in the first phase averaged a maximum higher than 40°C during the campaign period. On the other hand, 3.4%, 18.1%, 27.1% and 10.2% PCs in the second, third, fourth, and fifth phases respectively averaged a maximum higher than 40°C.
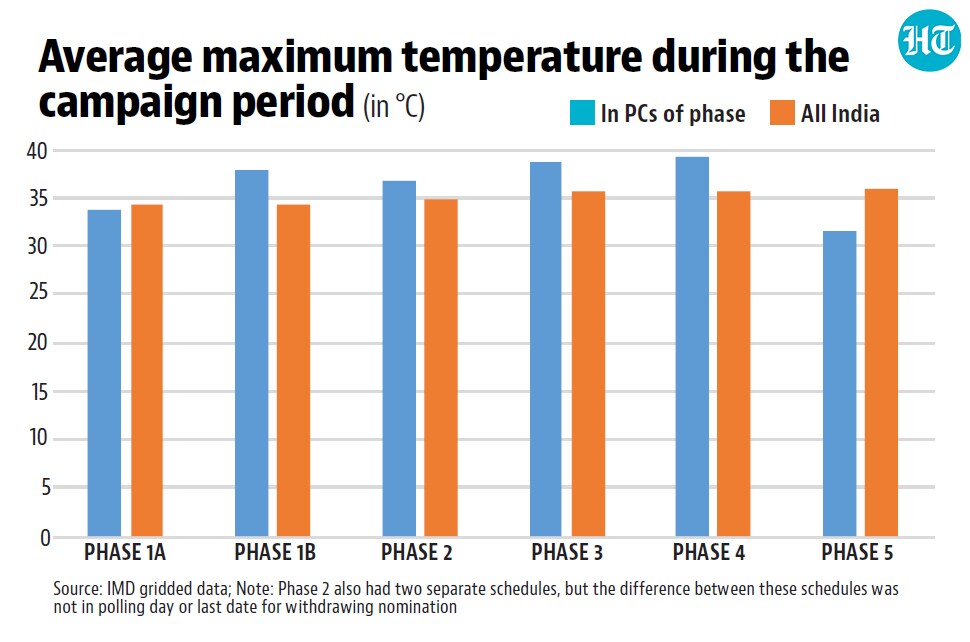
- In 3 out of 5 phases, the maximum in the campaign region was higher than the rest of the countryThe trend shown above was largely expected. However, what was unexpected is that in each phase, the maximum in the campaign region would be higher than in the rest of the country. This trend was true in three out of five phases (except the first and fifth). To be sure, in the third phase, the trend was likely driven by a few PCs experiencing very high maximums. The proportion of PCs where the campaign period maximum averaged higher than 40°C in third phase was 18%. However, at the national level 28% PCs averaged a maximum higher than 40°C in the same period. Moreover, a consolidated comparison of the first phase PCs is not strictly possible because it had two separate schedules. The last date of withdrawing nominations was April 2 for the first-phase PCs in Bihar, but March 30 elsewhere. The average campaign maximum was higher than the rest of the country for the Bihar PCs, but not others.
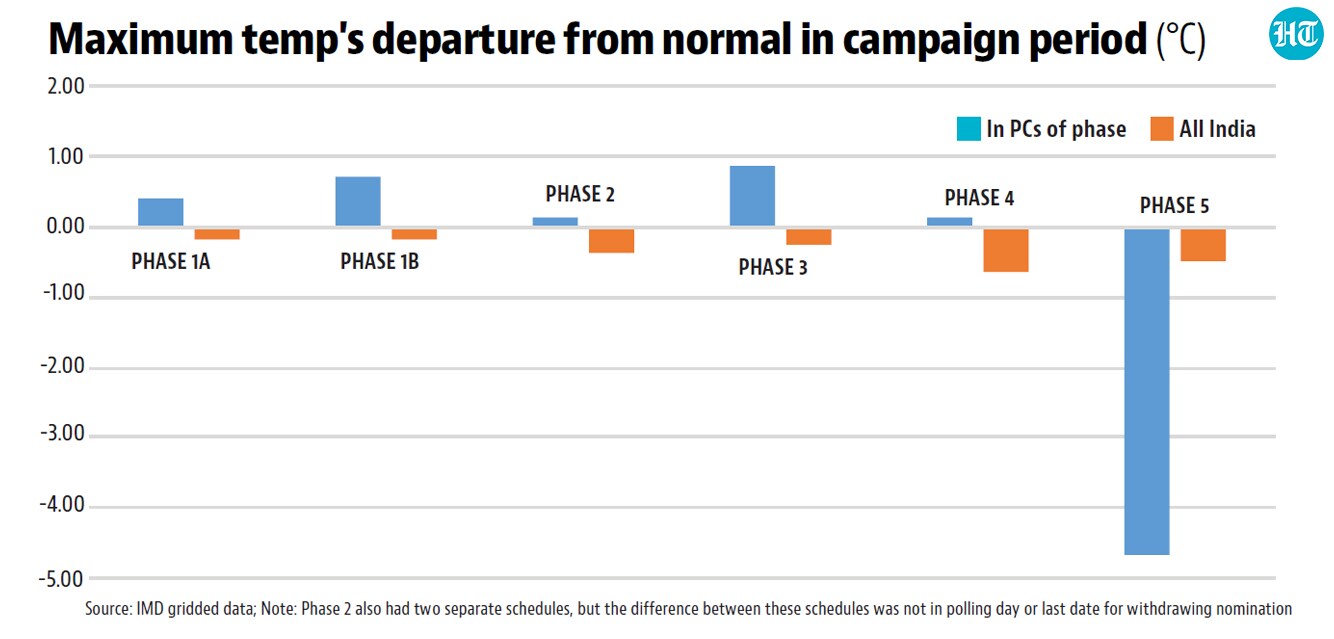
- Maximums warmed up where polls were scheduled, but not elsewhereA trend expected even less was that the maximum temperature would warm up compared to the normal in the region where polls were scheduled, but not elsewhere. However, this was true in four out of five phases (all except the fifth). The region going to polls generally experienced a warmer than normal maximum during the campaign period while the country as a whole experienced a marginally cooler than normal maximum. To be sure, this trend was largely driven by a few PCs that experienced high warming. The proportion of PCs of the phase where the average campaign period maximum was warmer than normal was generally lower than this proportion at the all-India level.
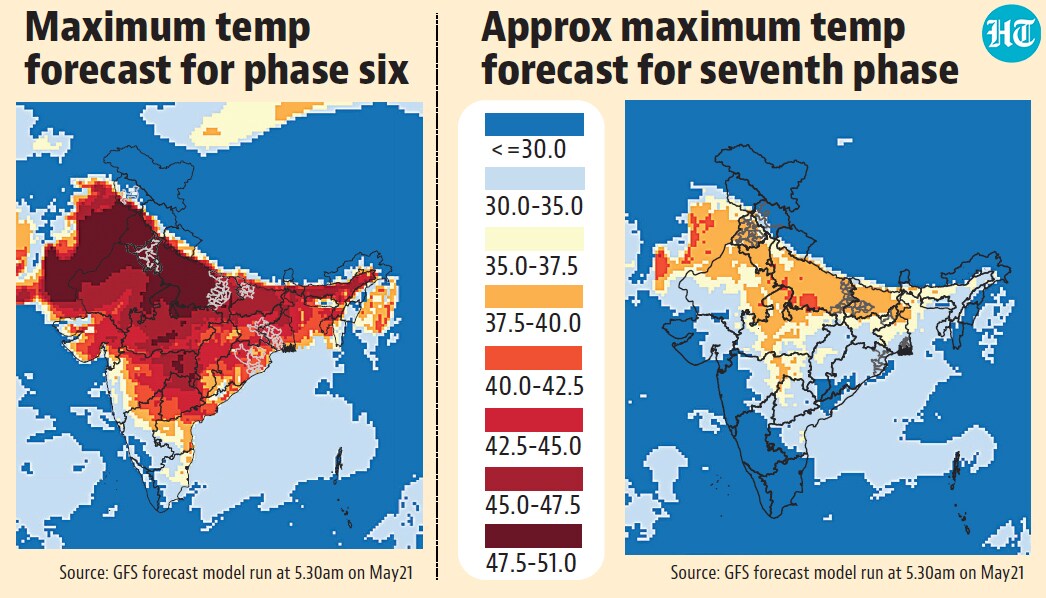
- These trends may hold true even in the next two phasesHT used the hourly temperature forecasts from the Global Forecast System (GFS) of the US National Weather Service to generate maximums for the polling day for the next two phases. These forecasts suggest that the trend seen so far these elections might also hold true in the next two phases. The average polling day maximum for the sixth phase PCs is 44.5°C compared to the national average of 39.3°C. While the seventh phase maximum computed from the GFS forecast will be an underestimate at this stage (the forecast for a date more than five days ahead is available only at three-hour intervals), that also shows a similar trend.