E-Paper



Number Theory: Poverty and Scheduled Tribe identity in Jharkhand
This is the first of a two-part series on economic backwardness of STs in Jharkhand. The second part will look at the reason for economic backwardness of STs.

 Prefer HTon Google


Jharkhand was carved out as a separate state in 2000, but the statehood movement is a much older demand fuelled by unfulfilled aspirations of Scheduled Tribe (ST) communities living in the region. The original Jharkhand movement was spread in areas beyond the geographical boundaries of the state as it exists today. A central fault-line runs between ST and non-ST communities, a divide that plays out in politics and will be among the key factors when the state hold its fifth assembly election on November 13 and 20. The Bharatiya Janata Party (BJP)-led alliance that won a majority in the assembly elections held in 2014 did not pick a chief minister from an ST community and paid for it in the 2019 elections, when the Jharkhand Mukti Morcha (JMM)-led alliance formed a government.
How are STs placed in the state’s economy? What are the reasons for their well-being or lack of it? How can the state hope to solve these differences? This two-part series using data from various official surveys will try to answer these questions. The first part will look at the economic position of the STs vis-à-vis other communities and the second part will try and link these questions with the state’s larger economy.
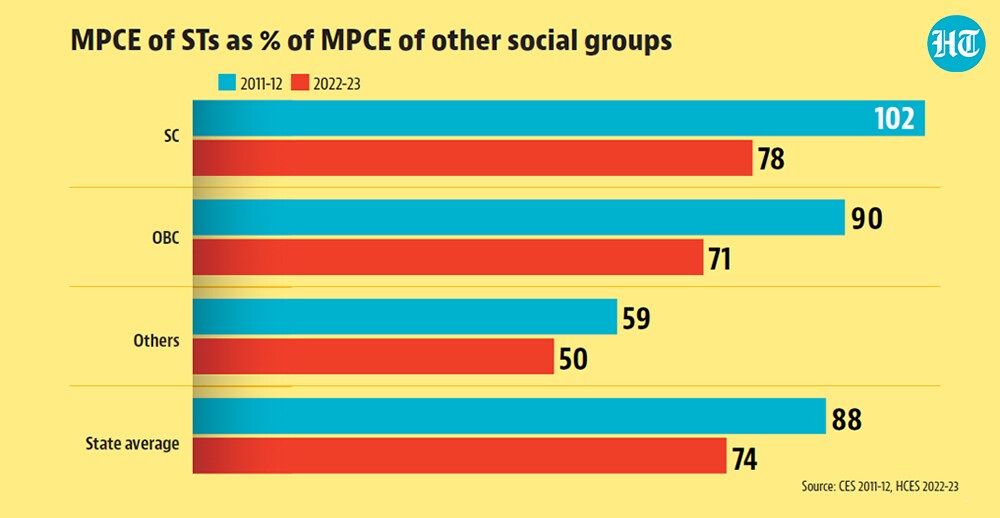
 STs have become worse off vis-à-vis other communities in Jharkhand between 2011-12 and 2022-23This becomes clear from a simple comparison of monthly per capita expenditure (MPCE) from the 2011-12 and 2022-23 consumption expenditure survey conducted by the National Sample Survey Organisation (NSSO). The average MPCE of STs was ₹2,342 in the 2022-23, which is the lowest among all major social groups, namely, Scheduled Caste (SC), Other Backward Classes (OBC) and persons who do not belong to either SC, ST or OBC communities. What is even more remarkable is the fact that average MPCE of STs have fallen further behind each of these groups compared to the 2011-12 CES. In fact, STs were marginally ahead of the SCs in terms of MPCE in the 2011-12 CES. This one statistic shows that STs have seen an increase rather than a decrease in economic backwardness in Jharkhand in the last decade and a half.
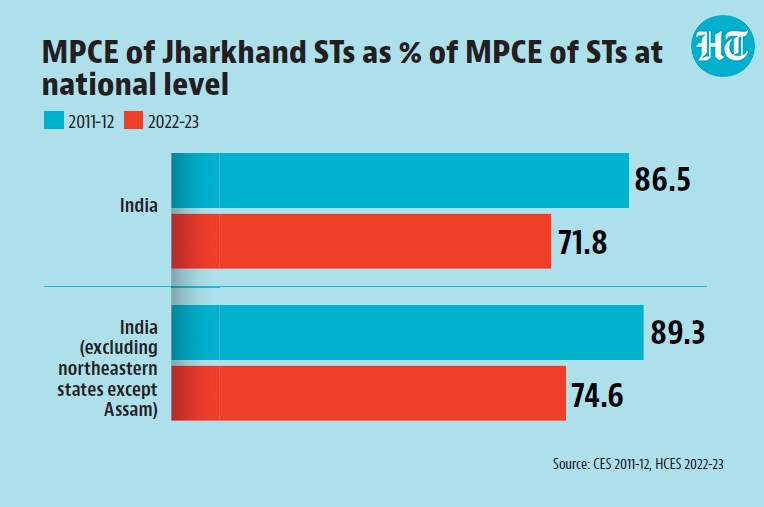
- Jharkhand’s STs are also worse-off than the average ST in India, the gap now bigger than in 2011-12Once again, 2022-23 HCES data makes it clear. Average MPCE for STs in Jharkhand was only 72% of the average MPCE for STs at the national level. If one were to take out the smaller north-eastern states (excluding Assam) – socio-economic dynamics are generally more favourable to the STs in these regions than the rest of India – this gap only reduces marginally, becoming 75%. A comparison with 2011-12 CES data shows that this gap has increased in 2022-23 compared to 2011-12. In 2011-22, the MPCE of STs in Jharkhand was 86% of the average MPCE ST in India and 89% of the average MPCE of STs outside north-eastern states (excluding Assam).
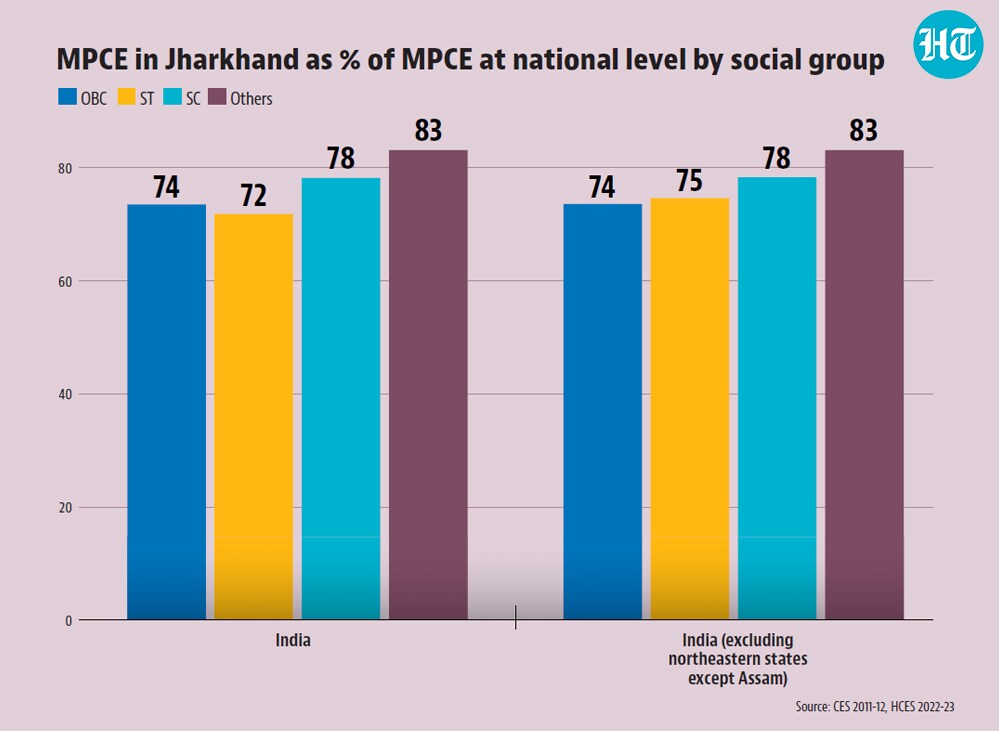
- But how much of the ST poverty in Jharkhand is attributable to its overall economic backwardness?This is the most important question to ask to understand the predicament of the ST population in Jharkhand. Is the reason STs in Jharkhand are poorer than say STs across the country because they lag behind other social groups in their own state, as can be seen in the first chart, or is it that Jharkhand itself is a poor state? One way to answer this question is to compare the MPCE of every social group in Jharkhand with the national average. A comparison for 2022-23 shows that MPCE for STs in Jharkhand had the biggest gap vis-à-vis the national average among different social groups. The fact that non-SC-ST-OBC groups have a much smaller gap with the national MPCE underlines the fact that social identity does play a role in economic fortunes in Jharkhand. The other remarkable thing about Jharkhand is the high relative backwardness of its OBCs vis-à-vis the national average. In fact, if one were to make a comparison with the national average MPCEs after taking out the smaller north eastern states, it is the OBCs, not the STs, who are the worst-off social group in terms of lag vis-à-vis national MPCEs.