Sign in

Number Theory: Bihar’s socio-economic landscape: known and unknown facts

Even though India stopped conducting a detailed caste census after 1931, the census does count the Scheduled Caste (SC) and Scheduled Tribe (ST) population separately.

Updated on: Jan 11, 2023, 07:25:56 IST
Share
Share via
  • facebook
  • twitter
  • linkedin
  • whatsapp
Copy link
  • copy link

The Bihar government has started the first phase of the caste census on January 7. While this will include the basic task of house listing, the second phase will collect detailed social (read caste) and economic information. The government has said that it hopes to complete the entire process by the first half of this year. While it is true that India has not had a proper caste-census since 1931 – this is what makes the Bihar government’s decision to conduct one a statistically and politically important decision – what is not is that in the absence of data, we know nothing about the broad socio-economic attributes of the state’s population. Various government surveys do provide information about this question at the broader, social-group level. Here are five charts that summarise what we can expect to know from the caste census in the state when its results are published.

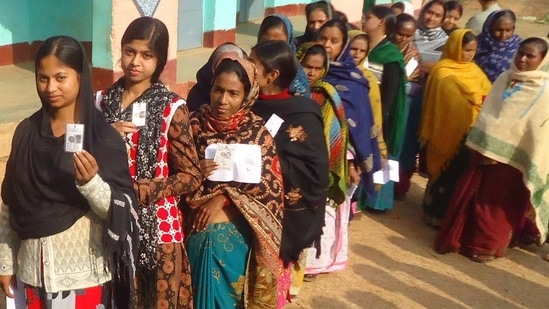
The Bihar government has said that it hopes to complete the entire process of caste census by the first half of this year. (HINDUSTAN TIMES)

Other Backward Classes (OBCs) constitute close to 50% of the state’s population

Even though India stopped conducting a detailed caste census after 1931, the census does count the Scheduled Caste (SC) and Scheduled Tribe (ST) population separately. Where the caste census hopes to provide information is about the demographic details of population that belongs to the OBC and non-SC-ST-OBC groups. To be sure, the broad details of this classification are not entirely unknown. Various government surveys, such as the National Family and Health Survey (NFHS) and multiple surveys conducted by the National Statistical Office (NSO) do give us a broad composition of the population. These results are largely consistent across surveys and suggest that OBCs had a share between 45%-50% of the population in Bihar. Of course, a caste census will tell us the intra-group division of population which surveys like the NFHS and NSO do not capture.

Caste does matter in terms of wealth but not so much for OBCs

Because NFHS collects data on household level wealth, it is possible to compare whether membership of a social-group plays a role in deciding wealth or lack of it for households. A simple comparison of relative shares of broad social groups shows that non-SC-ST-OBC Hindu population (often referred to as upper caste) is disproportionately represented in the ranks of the wealthiest whereas SC households are more likely to be concentrated among the poorest households. As far as OBCs are concerned, they largely have a uniform representation among both rich and poor households (more on this later).

Education and employment data shows similar inequality but of a slightly lower magnitude

Data from NSO’s 2020-21 Periodic Labour Force Survey (PLFS) shows that a similar kind of inequality, although lesser in magnitude, exists at the social level in both education and employment. While the non-SC-ST-OBC population has a higher relative share in number of graduates and workers with regular wages (they offer the highest income), the inter-group inequality is lower on these two counts than in terms of wealth as captured by NFHS data described above.

But there is limited information about intra-group inequality

This is where the caste census promises to be the most interesting. While broad social categorisation such as of SC, ST and OBC has been used for various kinds of policies including reservations, there is more than enough anecdotal evidence that there exist large intra-group differences especially within OBCs. To be sure, this is not entirely counter-intuitive, as OBCs have the largest share in the country’s and Bihar’s population. The fact that OBCs have a proportionate relative share in various asset quintiles in the NFHS data supports the argument that there are rich OBCs and there are poor OBCs. To be sure, this is not to say that OBCs are the only group with significant intra-group inequality. A 2018 World Bank paper captured some of this inequality at the jati-level in Bihar. We will have a lot more information on this question when the results of the caste census are finally published.

  • Roshan Kishore
    ABOUT THE AUTHOR
    Roshan Kishore

    Roshan Kishore is the Data and Political Economy Editor at Hindustan Times. His weekly column for HT Premium Terms of Trade appears every Friday.

Check India news real-time updates, latest news on Hindustan Times and more across India.