
 E-Paper



How bad is the current wave of Covid in India?
As India races to vaccinate enough people amid fears of mutant strains of the virus, here’s a quick look at how the second wave of infections is playing out.

 Prefer HTon Google


The story of India’s Covid-19 battle has changed (for the worse) in the past month. For almost eight months after September, when India’s first wave peaked, the country saw a steady decline in daily cases and deaths -- but a second wave that started mid-February is now undoing months of progress made against the outbreak. How bad is the second wave? Are things as bad as fast as they were during the rise of the first wave? As India races to vaccinate enough people amid fears of mutant strains of the virus, here’s a quick look at how the second wave of infections is playing out.

1) This is the sharpest growth in daily cases since May 2020...
For the week ending March 23, India reported 42,162 new infections every day on average, the highest the 7-day average has touched since November 28, 2020. Last week, this number was 25,137, indicating the pace of the rise -- 7.7% over the past week. In other words, over the past week, every single day (on average) has seen 7.7% more cases than the day preceding it. How high is it? India hasn’t seen a rate of increase as high in at least 10 months, or since early May 2020 (it was also 7.7% for the week ending May 10).

However, a key difference from then is that the base at the time was very low compared to what it is now – the 7-day average of new cases on May 10, 2020 was 3,508, against 42,162 on March 23 Indeed, India’s case trajectory has gone from 20,000 to 42,000 in just 11 days , 10 days fewer than the 21 days it took to go from 20,000-to-42,000 during the first wave (between July 3 and July 24).
2) ... and also daily deaths
On average, 199 people have lost their lives to Covid-19 every day in the past week , the highest the death rate has been since the week ending January 13, 2021. A week ago, on average 140 people were dying every day. This pegs the average growth rate of deaths at 5.1%. This is the highest growth rate of deaths since the week ending June 22, 2020. However, deaths were artificially inflated that week because Delhi and Maharashtra both reconciled their Covid deaths on July 16, adding more than 1500 deaths to their tallies in a single day.

If we exclude numbers from that week, then the last time India saw a growth rate higher than 5.1% in deaths was (again) for week ending May 10, when the death rate was rising 5.8%.
3) At the current rate, India’s wave will overtake the US’s by March 27 and Brazil’s by April 2
Currently, Brazil is the biggest Covid hot spot in the world – reporting an average of 75,570 new cases every day on average. Next is the US, which is, on average reported 54,141 new infections of Covid-19 every day in the past week. With a seven-day average of new cases at 42,162, India is at the third spot. However, India’s cases are rising at a far faster pace than the first two. In fact, the case rate of the US is currently declining. In the past week, the US’s daily case rate has dropped by 0.2%. While Brazil’s case rate is rising, it is doing so at a much slower pace than India’s – 1.4% against India’s 7.7% average growth in the past week.
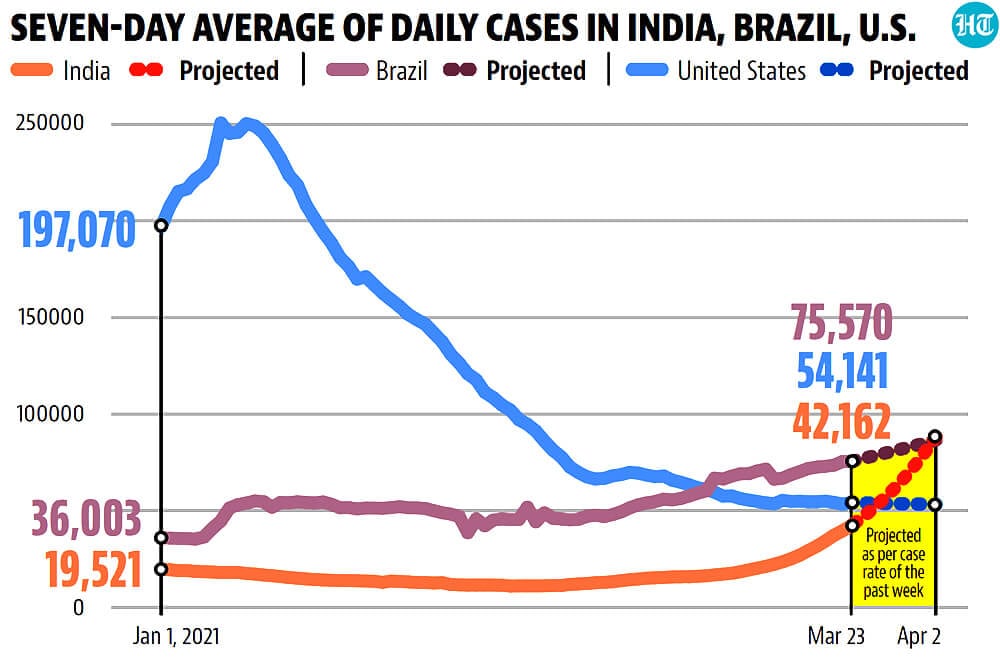
If these countries maintain this growth rate (or in the US’s case, decline rate) in the near future, then India’s trajectory of daily cases is set overtake the US in just four days (by March 27) and Brazil in 10 days, or by April 2.
4) Are fewer people dying in the second wave?
Some number crunchers have claimed as much. Overall, of the 11,554,894 people infected across the country, 159,615 people lost their lives to Covid-19 till Tuesday night (March 23). This places the country’s case fatality rate (CFR) at 1.4%. However, in the initial months of the outbreak, a larger proportion of people were dying as doctors took time narrow down on effective treatments, and the health infrastructure was in the process of being strengthened. As a result, India’s CFR has steadily been improving – it was 3% till the end of June; it improved to 1.6% by the end of September. In the last six months, only 1.1% of cases have resulted in deaths. In order to see if the second wave has had a lower death rate, we plotted the seven-day average of deaths (with a 14-day lag) against the seven-day average of cases since October 1, 2020 at a ratio of 0.011:1 (as the CFR since October is 1.1%). The 14-day lag was taken because a February 2020 study showed that it took an average of 14 days from infection to death. This plot shows that the death trajectory is nearly identical to the case trajectory in the second wave, which means that so far there has been no major deviation from the 1.1% death rate.
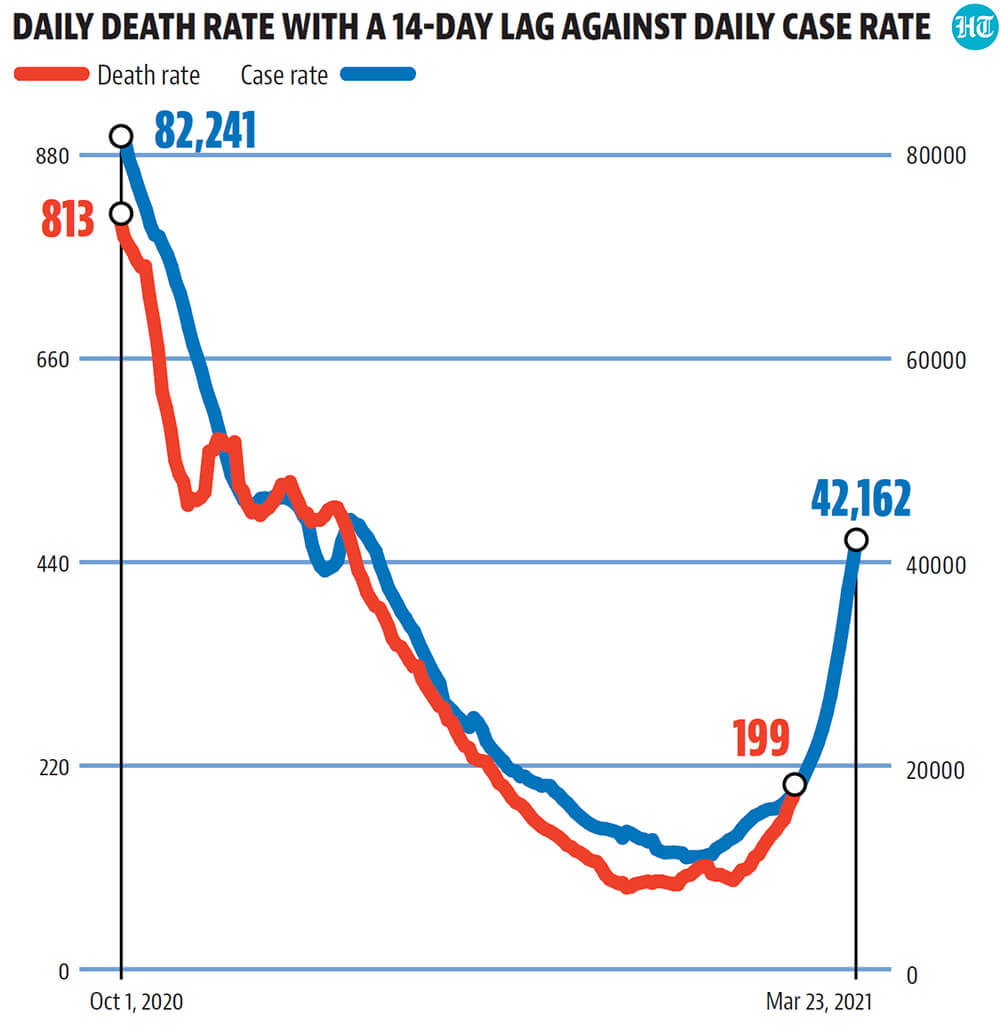
Put otherwise, it means there is no change in the case fatality rate between October and now, although, to be sure, this proportion is lower than how many people have died from the disease overall (CFR of 1.4%) and also lower than the proportion of people who died till September 2020 (1.6%).


