E-Paper



Number Theory: Is Rajasthan’s labour market very different from the national one
Here are five charts that answer this question using Periodic Labour Force Survey (PLFS) data
Published on: Nov 23, 2023, 07:59:43 IST


Share via


Copy link

Employment is among the most ubiquitous election issues in India. Both the Bharatiya Janata Party (BJP) and the Congress, for example, have promised in their manifetos that they will create jobs in Rajasthan, which will vote on November 25. How big or small a role that expected to play in Rajasthan? Are employment statistics in the state in sync with or significantly different from what they are at the all-India level? Here are five charts that answer this question using Periodic Labour Force Survey (PLFS) data
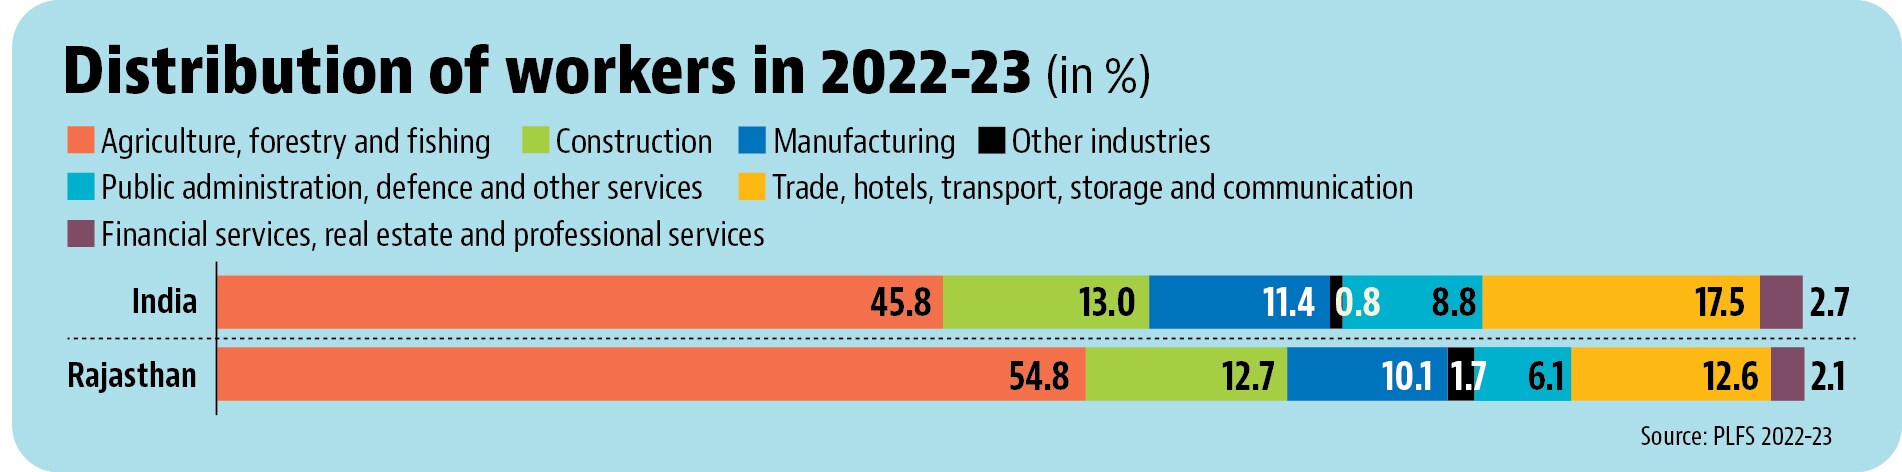
 Is Rajasthan’s labour market very different from the national one?This question merits an analysis on three levels: The gender composition of the labour market, given a big differential between male and female labour force participation rate (LFPR); the broad industrial break-up of workers; and unemployment numbers. Here is what the 2022-23 PLFS data shows. Rajasthan’s labour force is marginally closer to gender equality than that of India overall. The break-up of the labour force in Rajasthan is 61% to 39% in favour of men in comparison to a 68% to 32% split at the national level. This is also reflected in the broad industrial break-up of workers. The proportion in agriculture, a sector of far more importance to women workers than men, is nine percentage points higher in Rajasthan. This is compensated by government-related services jobs and trade, hotels, transport, storage and communication industry having a lower share in the state. The most common indicator of labour market health, however, is the unemployment rate. This tells us the share of people in the labour market – the total working and job-seeking population – who are looking for work. This number was higher in Rajasthan by more than a percentage point compared to the national figure in 2022-23. Chart 1
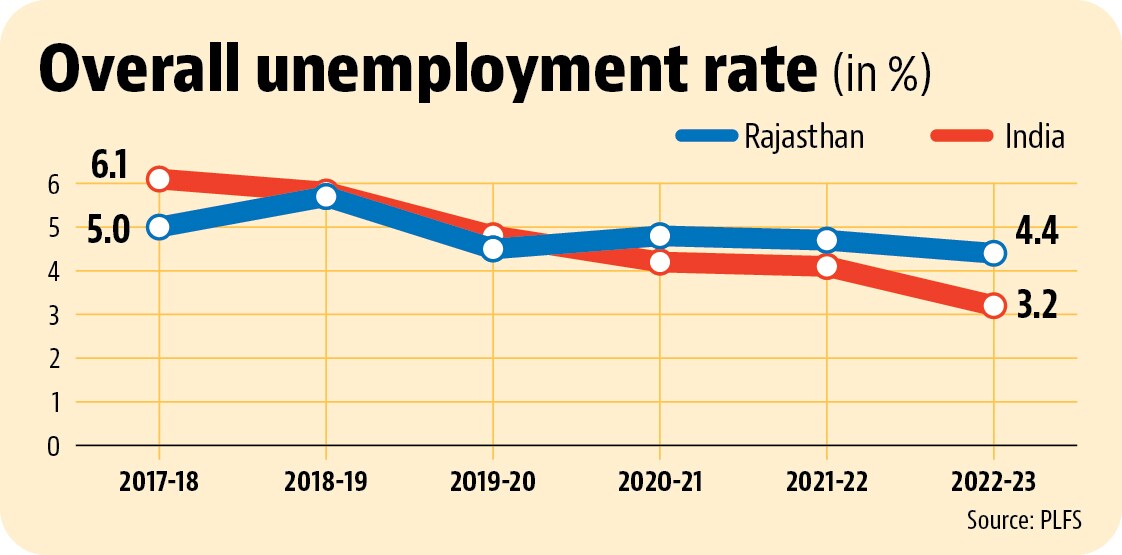
- What has happened to unemployment in Rajasthan under this government?Because the first PLFS began in 2017-18, data is available on almost the entire term of the current government in Rajasthan. The headline unemployment rate, which was 5% in 2017-18, reached a peak of 5.7% in 2018-19 and has fallen to 4.4% in 2022-23. The corresponding national figure is a fall from an unemployment rate of 6.1% in 2017-18 to 3.2% in 2022-23. Therefore, trend of the overall unemployment rate declining is not very different from what has happened at the all-India level, as is shown in the accompanying chart, with one caveat. Rajasthan’s unemployment rate has been stickier than India’s. Although it has followed the same broad trend, it was better than the India rate from 2017-18 to 2019-20, and is worse than it in the next three years. Chart 2
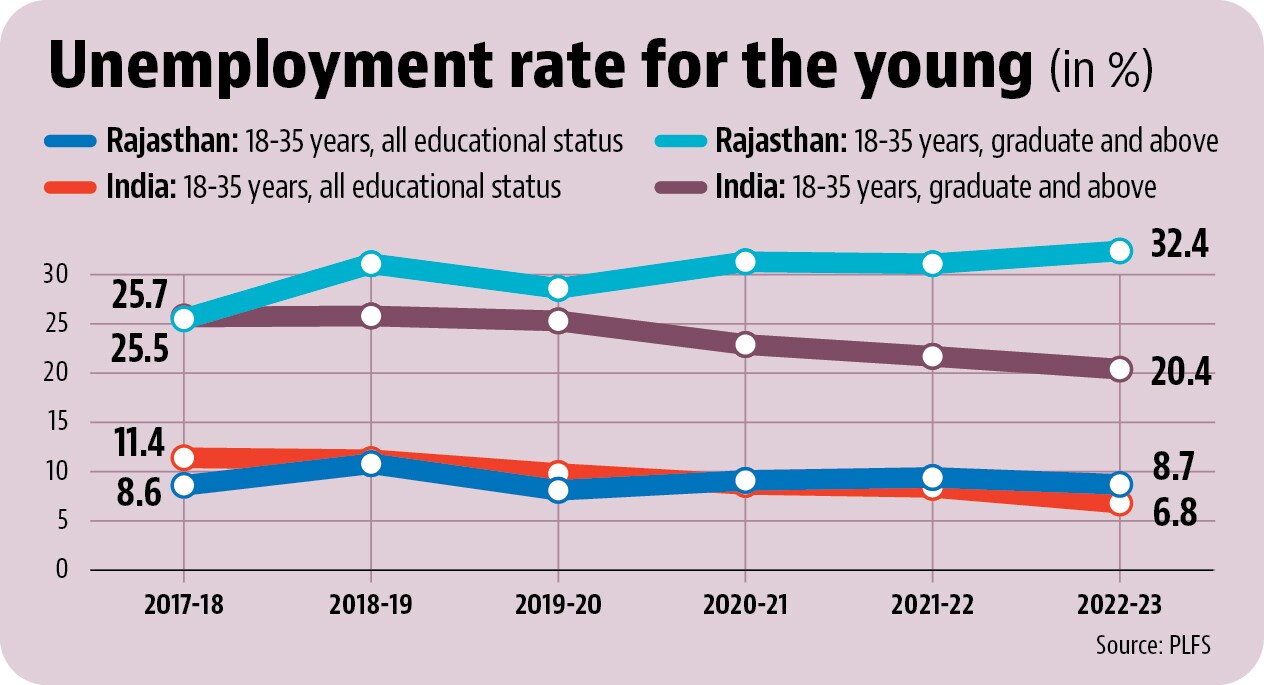
- Does an overall fall in unemployment mean jobs will be less of an issue in Rajasthan?Not at all -- in fact, it is a big area of concern going into the elections. The way most surveys including PLFS define unemployment rate is a very minimalist measure of insecurity in the job market. Also, the headline unemployment rate is demography-agnostic, and does not capture the severity of the problem for young job-seekers. The unemployment rate for young workers (18-35 years) in Rajasthan and at the national-level is 8.7% and 6.8% respectively. These number rise to 32.4% (Rajasthan) and 20.4% (national) for job-seekers in the 18-35-year cohort with a graduate degree. The picture was different in 2017-18, when Rajasthan’s overall unemployment rate for the young was less than the national rate, and that for young graduates was roughly the same. Chart 3
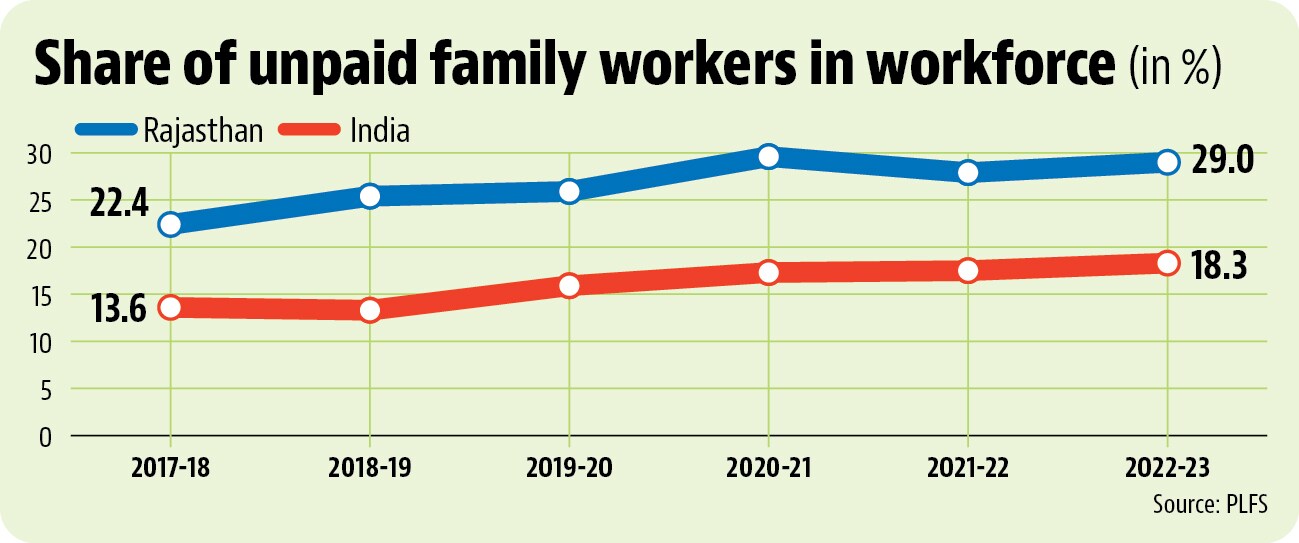
- What the unemployment rate numbers hide in RajasthanThe debate about people taking jobs which do not do justice to their aspirations or qualification notwithstanding, the least one can expect from a job is that it would ensure a regular income. However, PLFS data shows that even this criterion is not fulfilled for a lot of jobs in both Rajasthan and at the all-India level. About 29% workers in Rajasthan and 18.3% at the national level were unpaid family workers in 2022-23. These numbers were 22.4% and 13.6% in 2017-18 -- relatively better than now but not good. Chart 4
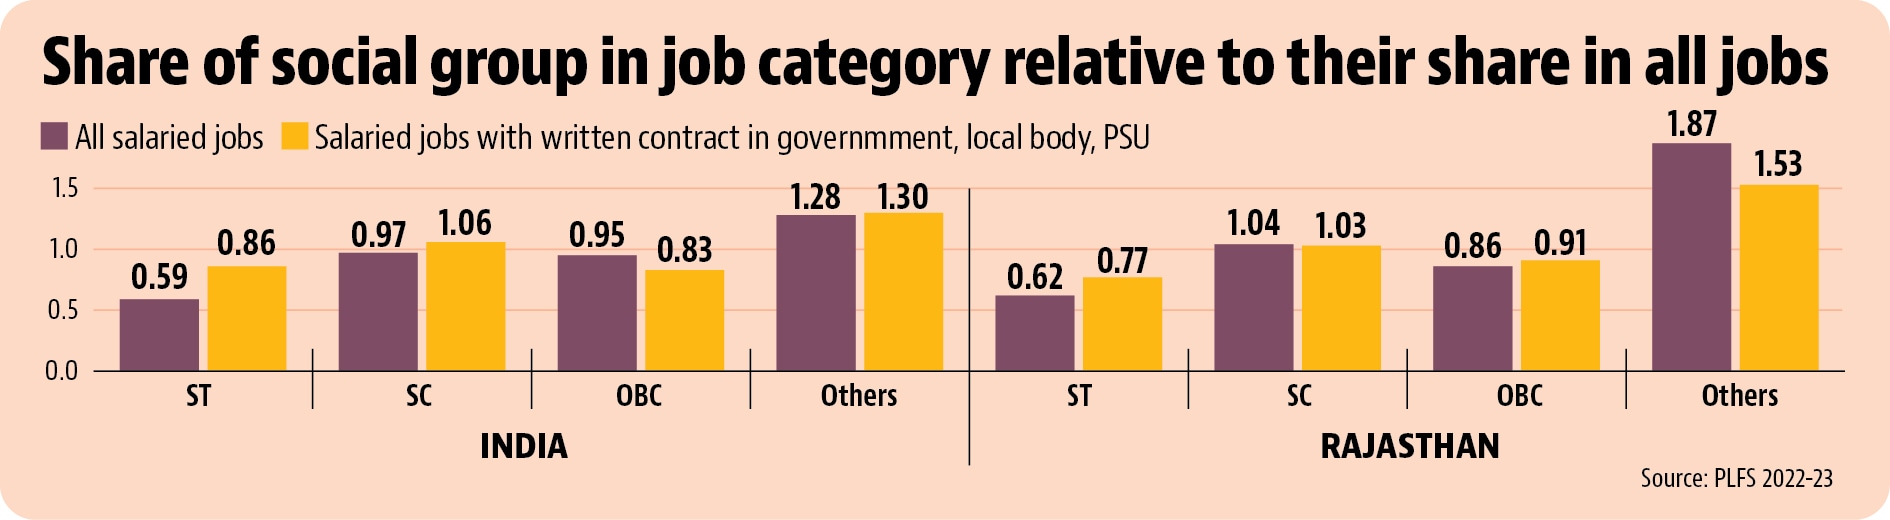
- Social aspect of labour marketClearly, good jobs (those that pay a regular wage) are scarce both in Rajasthan and India. The social distribution of good jobs, therefore, becomes important politically. The data shows that Scheduled Tribes (STs) and other backward classes (OBCs) are underrepresented in Rajasthan in regular wage or salaried jobs, while Scheduled Castes (SCs) are represented in proportion to their share among workers. On the other hand, those who do not belong to any of these groups are over-represented in such jobs. This is roughly the same as at the all-India level, except that OBCs are not as underrepresented. To be sure, the only way governments can ensure proportional representation in different kinds of jobs quickly is through reservation in formal government jobs. The broad trend in Rajasthan remains the same in such jobs as overall salaried jobs, although, as expected, the representation of STs and OBCs improves. The all-India situation on this count is similar to that of Rajasthan. So, in a nutshell, unemployment may be a bigger issue in Rajasthan than it is in the rest of the country -- particularly for educated young people. However, as far as the politics around reservation in government jobs is concerned, the problem is the same as it is elsewhere in the country. Chart 5