
 E-Paper



Charting Mumbai's progress through 2020 in 4 graphs
Mumbai reported the first Covid-19 infection on March 9, 2020 and has since then, recorded some of the highest cases and deaths.


On March 9, 2020, a Pune-based middle-aged couple that had returned from Dubai tested positive for Covid-19: the first infections in the state. Two days later, Mumbai reported its first two cases: a 70-year-old Andheri-resident and his 68-year-old wife, who were part of the same Dubai-returned group. Jamie Mullick and Kushel Madhusoodanan look at how Mumbai, one of the worst -affected metropolises in the country, consistently recording some of the highest cases and deaths, fared till the start of February 2021.
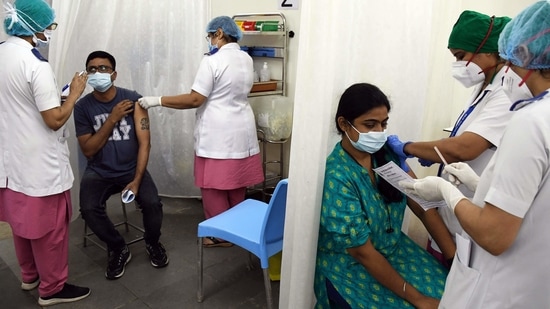
As of March 8, Mumbai has seen 334,583 cases, including 10,779 active infections, and 11,508 deaths. Mumbai has conducted 3.43 million tests with an overall positivity rate of 9.74%
CASELOAD

As things stand, the seven-day average of cases in Mumbai is at the worst since November-end. It still remains significantly below the peak of the first wave though. The Covid-19 trajectory in the city peaked at an average of 2,268 new cases a day for the week ending October 3. After hovering around the 500-800 fresh cases mark since December 1, the city has started reporting over 1,000 new infections every day since February 24.
CASE FATALITY RATE

Despite having reported nearly half of Delhi’s cases, Mumbai has seen more deaths, making the city one of the worst performers in case fatality rates (CFR) in the country. As of March 1, 3.5% of all people infected with Covid-19 in the city have lost their lives, the biggest proportion among the metros, and 2.5 times the national average. On February 22, Mumbai reported zero deaths due to Covid-19, its first such day since March 31, 2020, indicative of the welcome dip in CFR from around 6% in June 2020 to 4% in January 2021, followed by 3.58% in February 2021.
POSITIVITY RATE
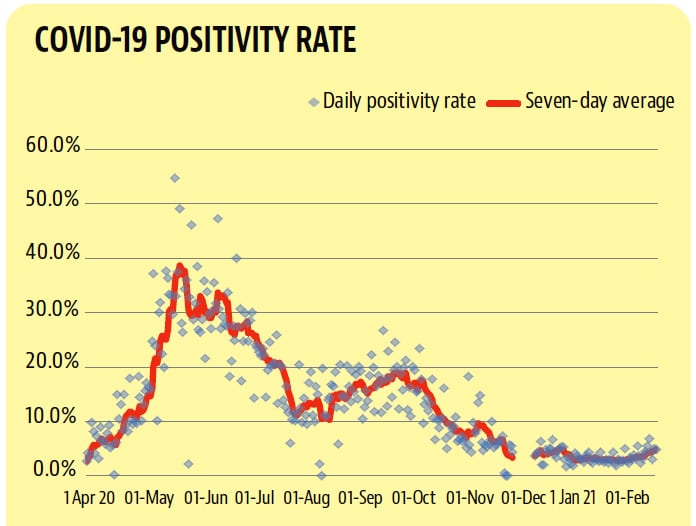
The city’s positivity rate — cases testing positive for Covid-19 against the tests done — is again steadily on the rise, which means the virus is spreading. While an average of 4.7% for the final week of February is nowhere close to the 38% witnessed in May (when testing numbers were really low at 4,000 to 5,000 a day), it was 2.8% in the first week of February, the lowest ever recorded for any week in the city. Overall, 9.74% of all tests have been positive in the city.
TESTING

The most significant T of the state’s “3T” strategy — tracing, testing and treatment — is the only sphere where the city administration has not faltered. The testing rate of 19,015 samples a day on an average for the week ending February 25 is the highest the city has ever done. Reacting to the recent rise in cases, the Brihanmumbai Municipal Corporation (BMC) has ramped up its testing in the past two weeks to an average of 18,000-22,000 per day against the 11,000-15,000 tests conducted in January and the first week of February.


Stay updated with all the Breaking News and Latest News from Mumbai. Click here for comprehensive coverage of top Cities including Bengaluru, Delhi, Hyderabad, and more across India along with Stay informed on the latest happenings in World News.


