
 E-Paper



How extreme has El Nino's impact been so far? | Number Theory
The El Nino that took hold in the April-June period is now reaching maturity, with its peak expected during November-January
Updated on: Nov 16, 2026, 06:47:12 IST

 Prefer HTon Google

Share via


Copy link

The El Nino that took hold in the April-June period is now reaching maturity, with its peak expected during November-January. This means the phenomenon – a periodic warming of sea surface temperatures (SSTs) in the central-eastern equatorial Pacific Ocean – has had enough time for some of its effects to unfold. How extreme have these effects been so far? Here are four charts that answer the question.
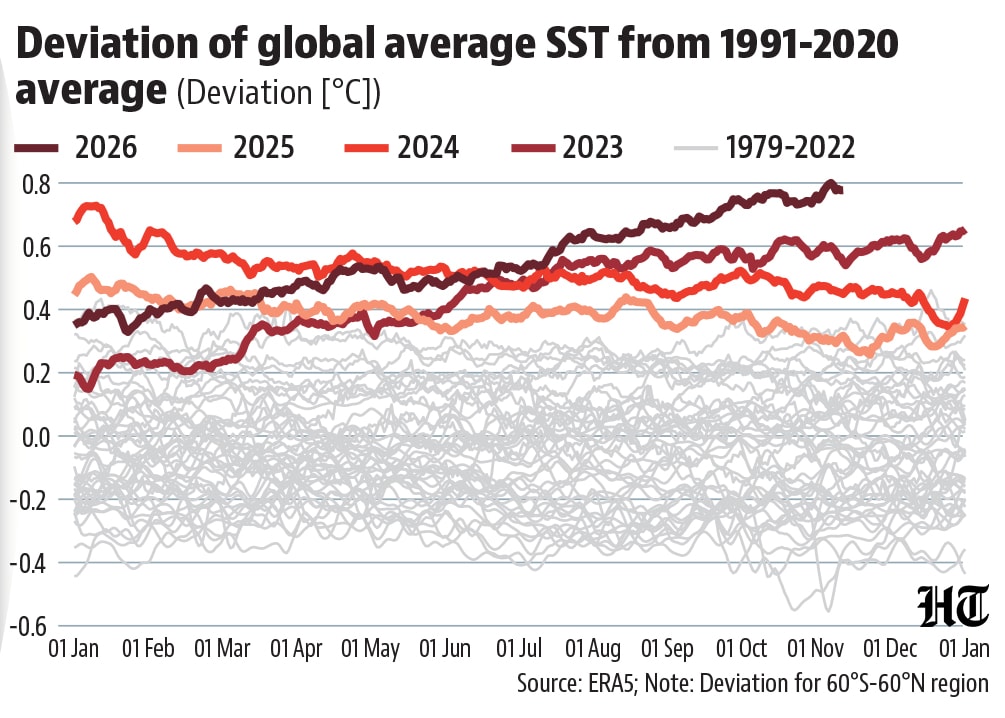
 SSTs have already broken all recordsCompared with October, the probability of the current El Nino breaking previous records dating back to 1950 declined in the forecast issued by the National Oceanic and Atmospheric Administration (NOAA) on November 12. However, the temperature indices used to track El Nino are relative metrics. In absolute terms, both the average global SST and the average SST in the Nino 3.4 region – the region tracked usually for El Nino – are already at the highest ever. This also underlines that most of the heat being seen in the oceans this year is the result of long-term accumulated heat that El Nino has just uncorked.
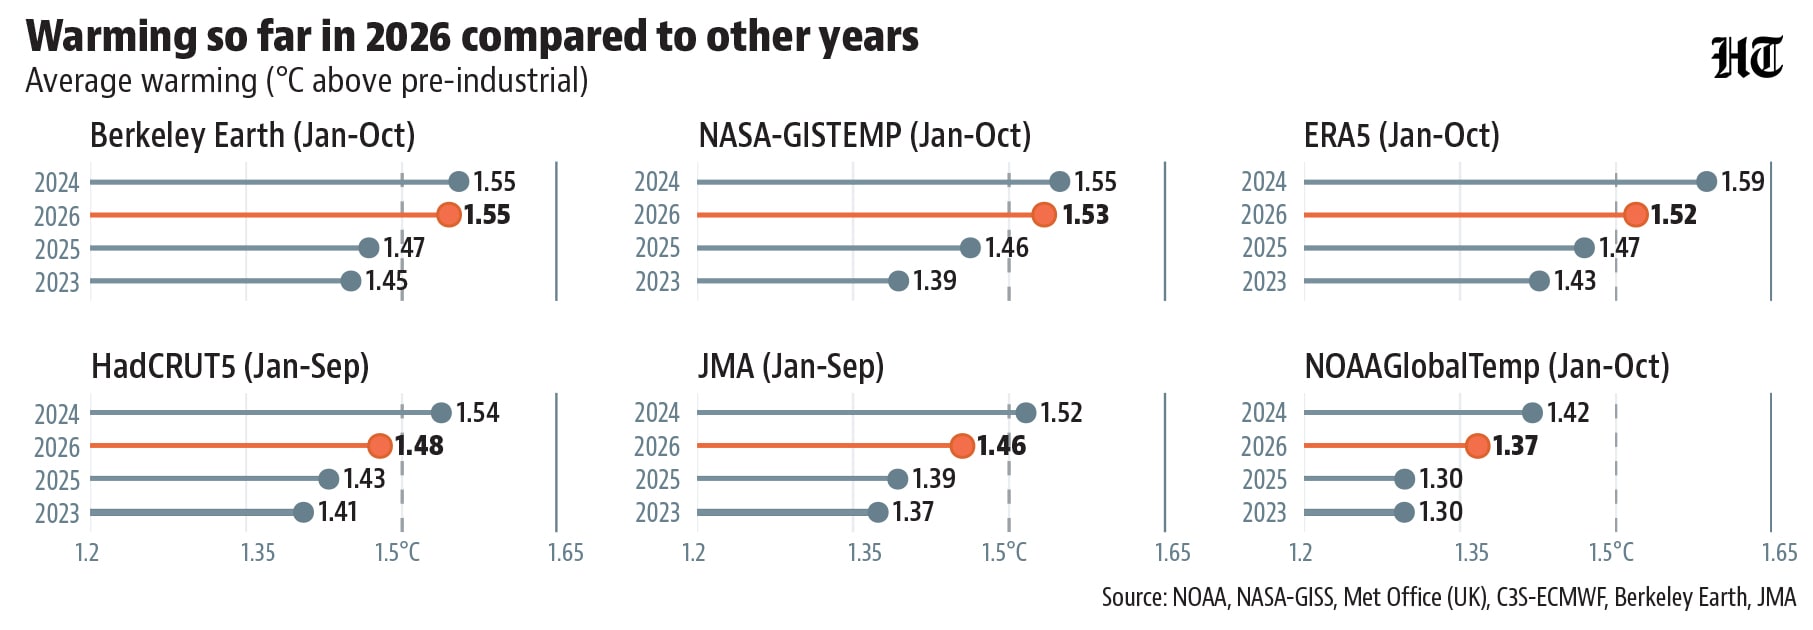
- 2026 almost certain to be second year of 1.5°C warmingEl Nino also affects the atmosphere above the Pacific and thereby weather around the world. One result of this is that it pushes up global average temperature, usually with a lag of two-four months. In 2026, this increase is almost certain to take the annual average deviation from the pre-industrial average above the 1.5°C threshold for the second time after 2024. Four of the six global temperature datasets tracked by the World Meteorological Organisation (WMO) have published their data up to October. All except the data published by NOAA (which tracks lower warming and didn’t breach the threshold even in 2024) show the threshold was breached in the average up to October although the year started off relatively cooler. With the deviation expected to inch higher in the coming months as the El Nino matures, it is almost certain that these datasets will end the year with even higher warming. Even other datasets were close to the threshold by September.
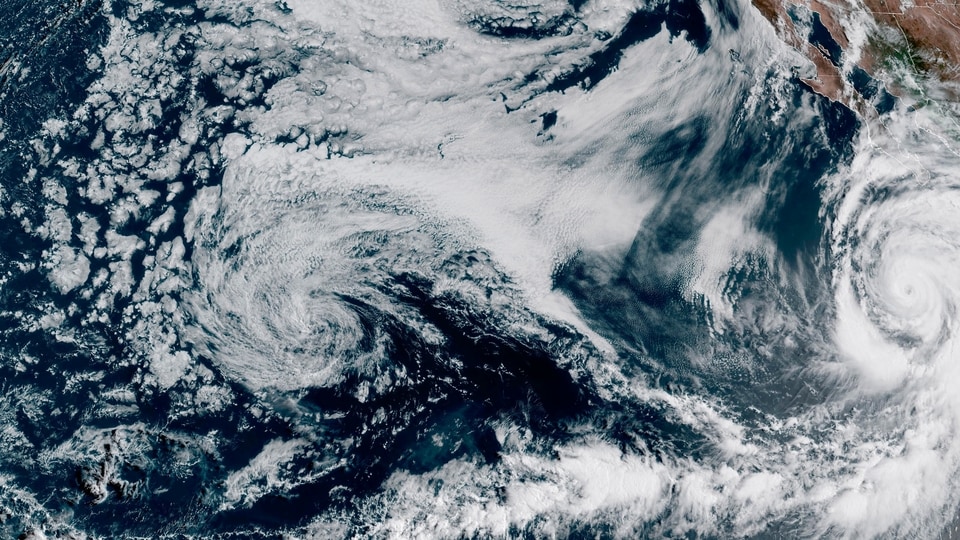
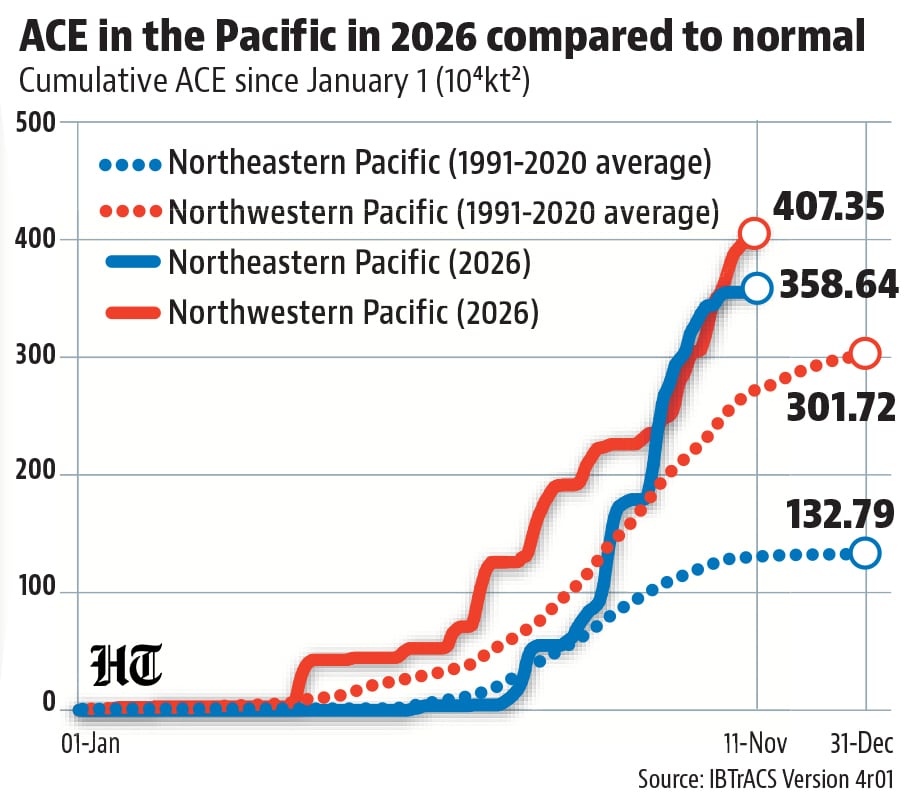
- Accumulated cyclone energy in the northeastern Pacific is the highest everWarmer oceans imply more energy for cyclones. Therefore, an El Nino leads to higher accumulated cyclone energy (ACE) – the cumulative sum of the square of the maximum sustained wind speed of cyclones -- in the Pacific. While an El Nino related warming is seen in the central-eastern Pacific, it can increase ACE in both the northeastern and northwestern basins (the main regions of Pacific cyclones), although the origin of cyclones in the latter shift eastward in an El Nino year. As expected from the SST trends, ACE so far in both basins is already higher than the normal for the entire year. In the northeastern Pacific, ACE so far has already beaten the full-year ACE of all years since 1950.
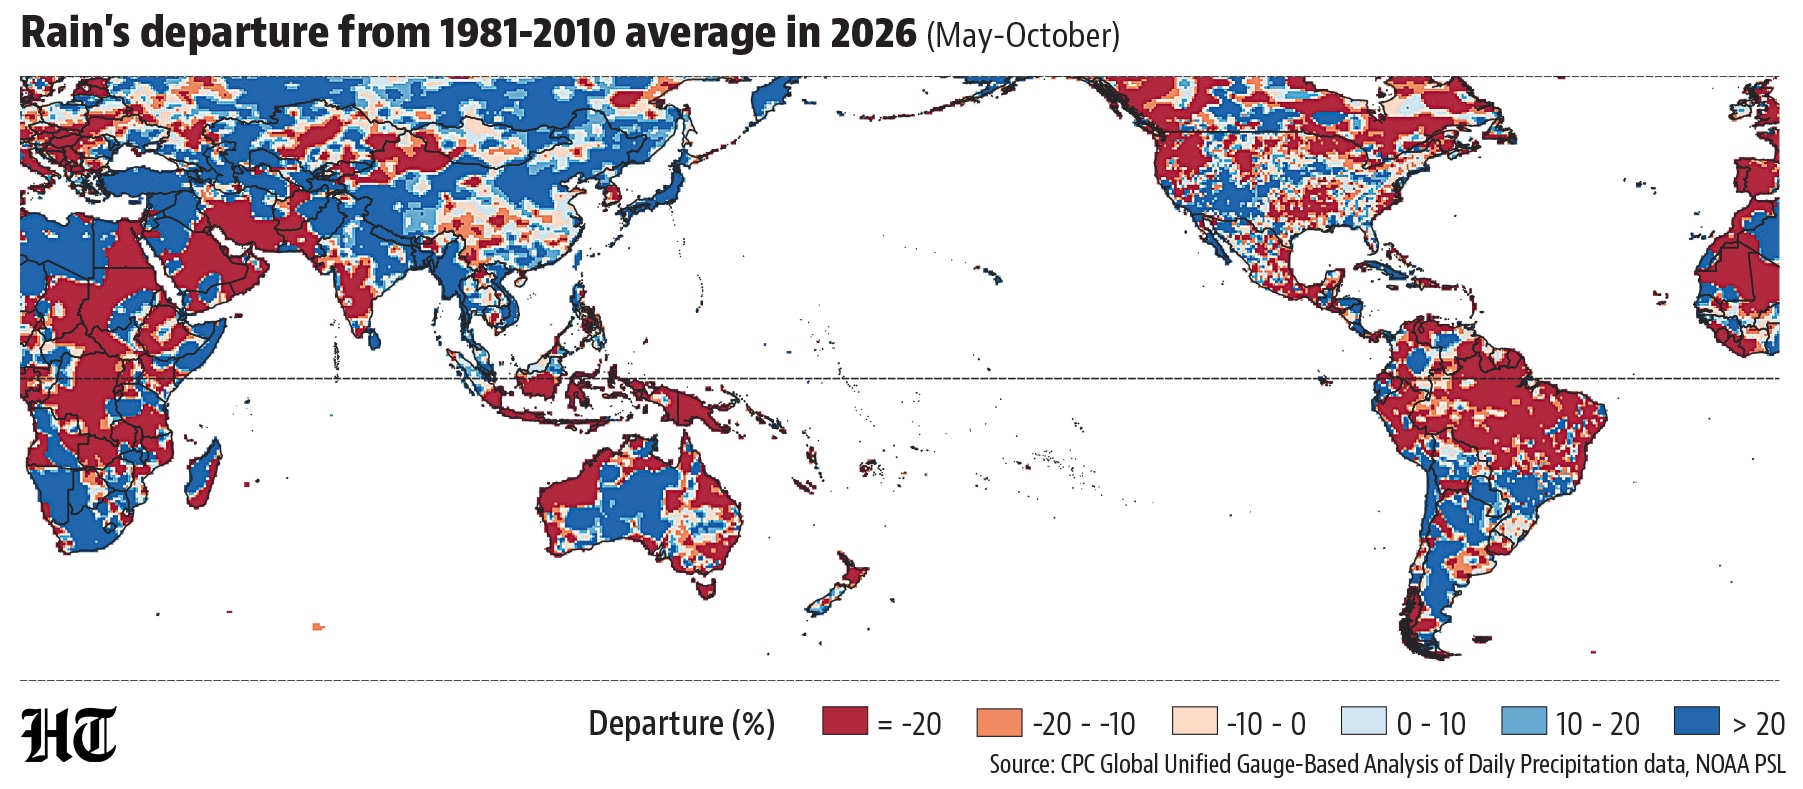
- Rainfall skew largely tracking other El Nino YearsEl Nino’s impact on rainfall is less straightforward. It makes some parts of the world (such as southern California and Florida in the United States) wetter than usual and others (such as India and southeast Asia) drier. Since May, when the El Nino started, this pattern has largely held. To be sure, this must be read with two caveats. One: The main rainy season of most of the southern hemisphere is yet to arrive. Two: The relation of El Nino with rain has also evolved over time. For example, the Indo-Gangetic plains were wet this monsoon, as the monsoon’s connection to El Nino has decreased in the region.
- While direct attribution to El Nino is difficult, the knock-on effect of extreme weather described above has been abundant in 2026. The WMO preliminary State of the Climate report for the year published November 9 attributes 30,000 excess deaths to the European heatwave this year and the resulting wildfires. Closer home, rain-dependent Maharashtra farmers have seen crop failures due to a drought brought likely by El Nino and Nepal saw a flash flood due to a glacier collapse aided by long-term warming that wiped out entire settlements. With El Nino expected to linger up to March-May 2027, more extreme events could occur next year.


Unlock a world of Benefits with HT! From insightful newsletters to real-time news alerts and a personalized news feed – it's all here, just a click away! -Login Now!


