
 E-Paper



What India wears - II | Number Theory
How do states differ when it comes to consumption spending on clothing and footwear in India? Here is what the data shows.
Updated on: Dec 15, 2025, 08:44:03 IST

 Prefer HTon Google
Share via


Copy link

The first part of this series looked at item-wise trends on spending by Indians on clothing and footwear. When it comes to wearables, India is also a land of regional diversity and not just economic diversity. How do states differ when it comes to consumption spending on clothing and footwear in India? Here is what the data shows.
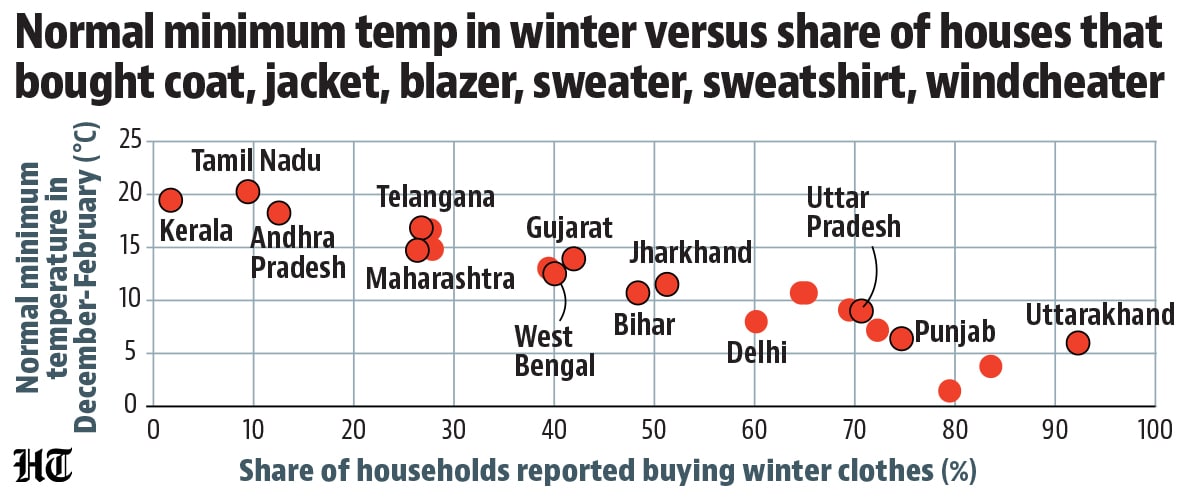
 Spending on winter clothing is strongly correlated with the intensity of winterOnce again, this is one of those instances where data makes perfect intuitive sense. If one were to compare the share of households that reported buying what can be broadly classified as winter clothing and the normal minimum temperature in the winter season (considered as the December-February period in India) in their state, there is a strong correlation between the two.
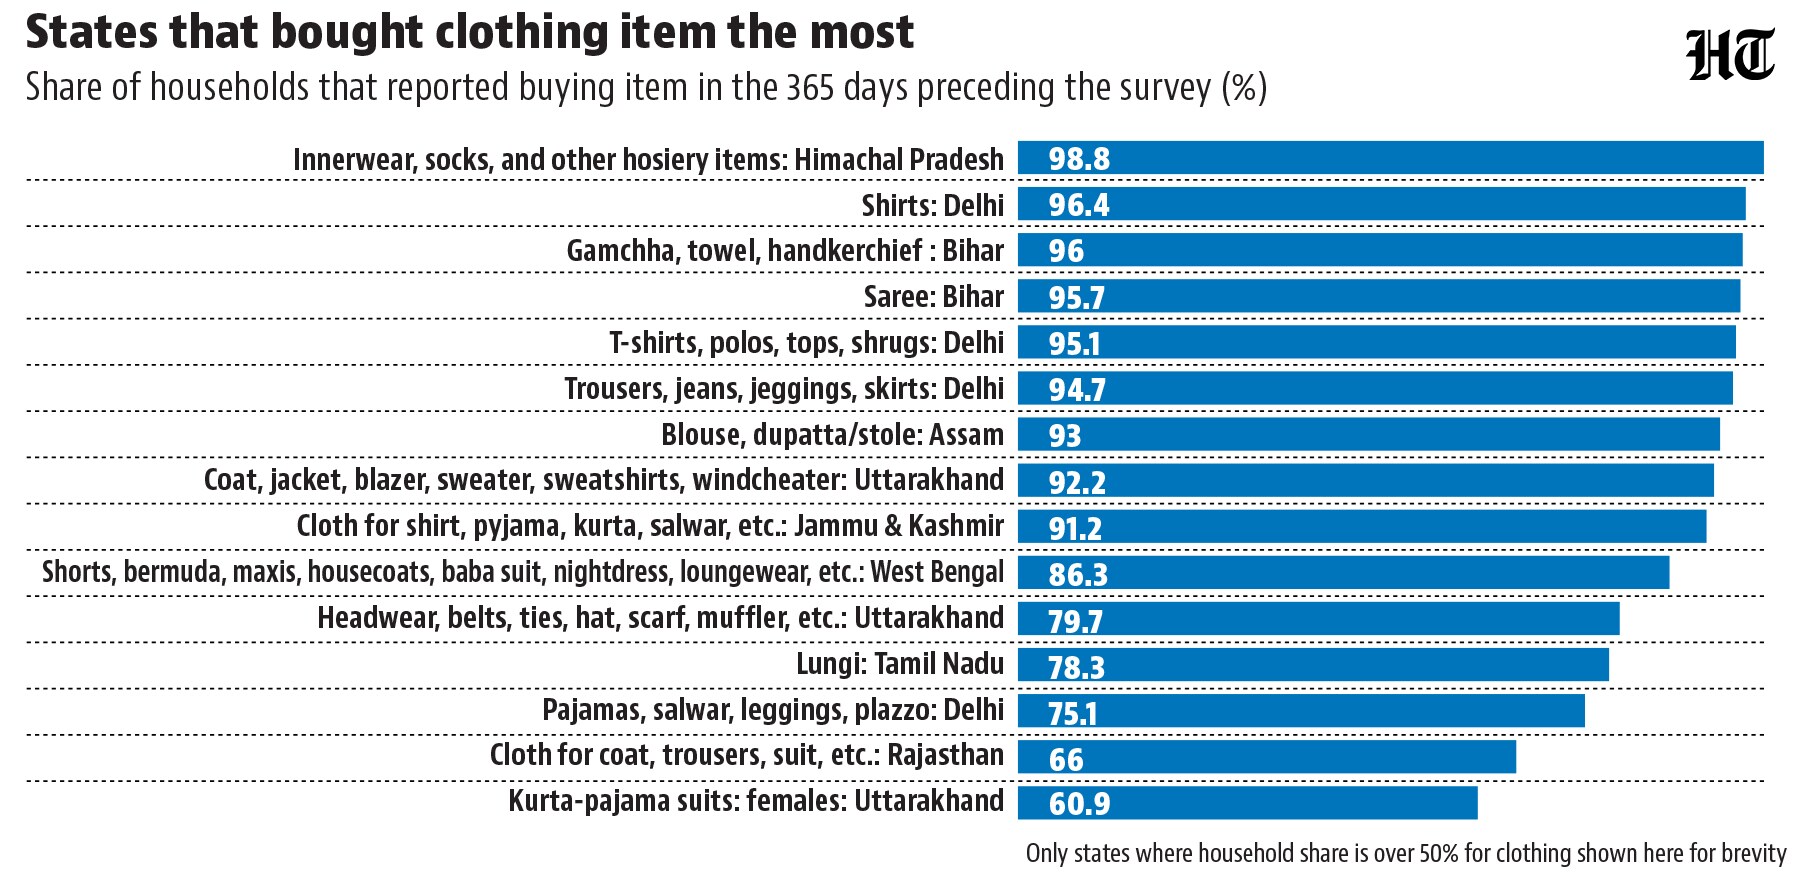
- Bihar has the highest share of households buying gamchhas, Tamil Nadu tops in dhoti/lungi buying households….While warmer states not buying winter clothes is almost obvious, there are interesting patterns to be seen in which state has the highest share of households buying a particular kind of clothing or footwear. HCES data shows that Bihar tops the rankings when it comes to share of households buying the broad category which includes gamchhas while Tamil Nadu has the highest share of households who buy a dhoti/lungi. The state is which tops the charts when it comes to buying a western suit is Chhattisgarh. Kerala, on the other hand, tops the rankings when it comes to share of households buying face masks and gloves. When it comes to footwear, Punjab tops the ranking when it comes to buying leather boots/shoes while Madhya Pradesh has the highest share of households buying rubber/PVC chappals.
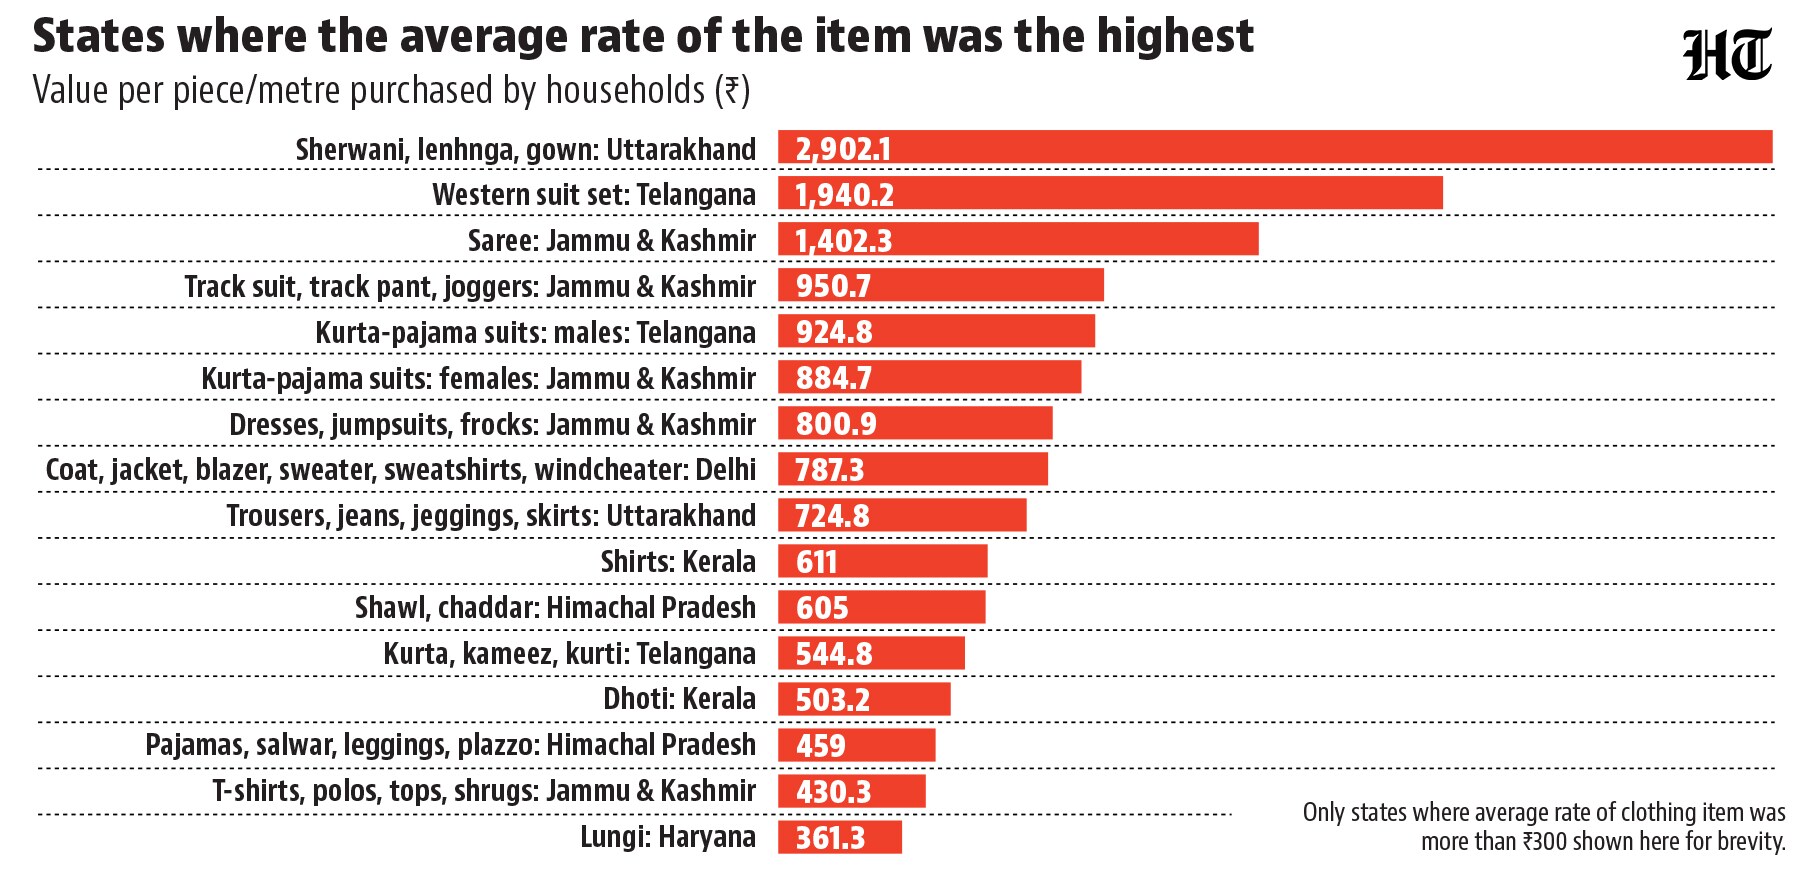
- …but some states wear more expensive shoes and sarees than othersThis is another interesting observation from the data. The state which reports more widespread use of a certain kind of clothing or footwear does not necessarily consume the more expensive varieties of this product on average. For example, only 2% of households in Jammu and Kashmir reported buying a saree (compared to 82% in the country overall), but the average per capita sending on it in the UT was the highest in the country among big states/UTs. Similarly, Uttarakhand spends much more on average on leather shoes/boots than Punjab which reported the widest consumption of this item. See Chart 3: https://datawrapper.dwcdn.net/iMH2P/1/
- Differences aside, there is a common thread which binds states when it comes to spending on wearablesOne can go on looking at the fine print of spending data on clothing and footwear in India. However, beyond all the diversity among states, there is also a common thread which ties India’s different states together when it comes to spending on wearables. India’s richer states spend more on clothing and footwear than their not-so-rich counterparts. This can be seen from the strong correlation between overall Monthly Per Capita Expenditure (MPCE) for states and its clothing-footwear sub-component. This also tells us something equally intuitive but often lost track of in the larger talk about growth and economy: Indians becoming richer will hold in the true sense of the term when they also buy many more shoes and shirts and jeans and not just cars or iPhones. See Chart 4:



Unlock a world of Benefits with HT! From insightful newsletters to real-time news alerts and a personalized news feed – it's all here, just a click away! -Login Now!


