E-Paper



Number theory: Four charts that decode the Bihar caste survey results
A look at the key takeaways from the findings of the data published on October 2.
Updated on: Oct 3, 2023, 04:43:55 IST


Share via


Copy link

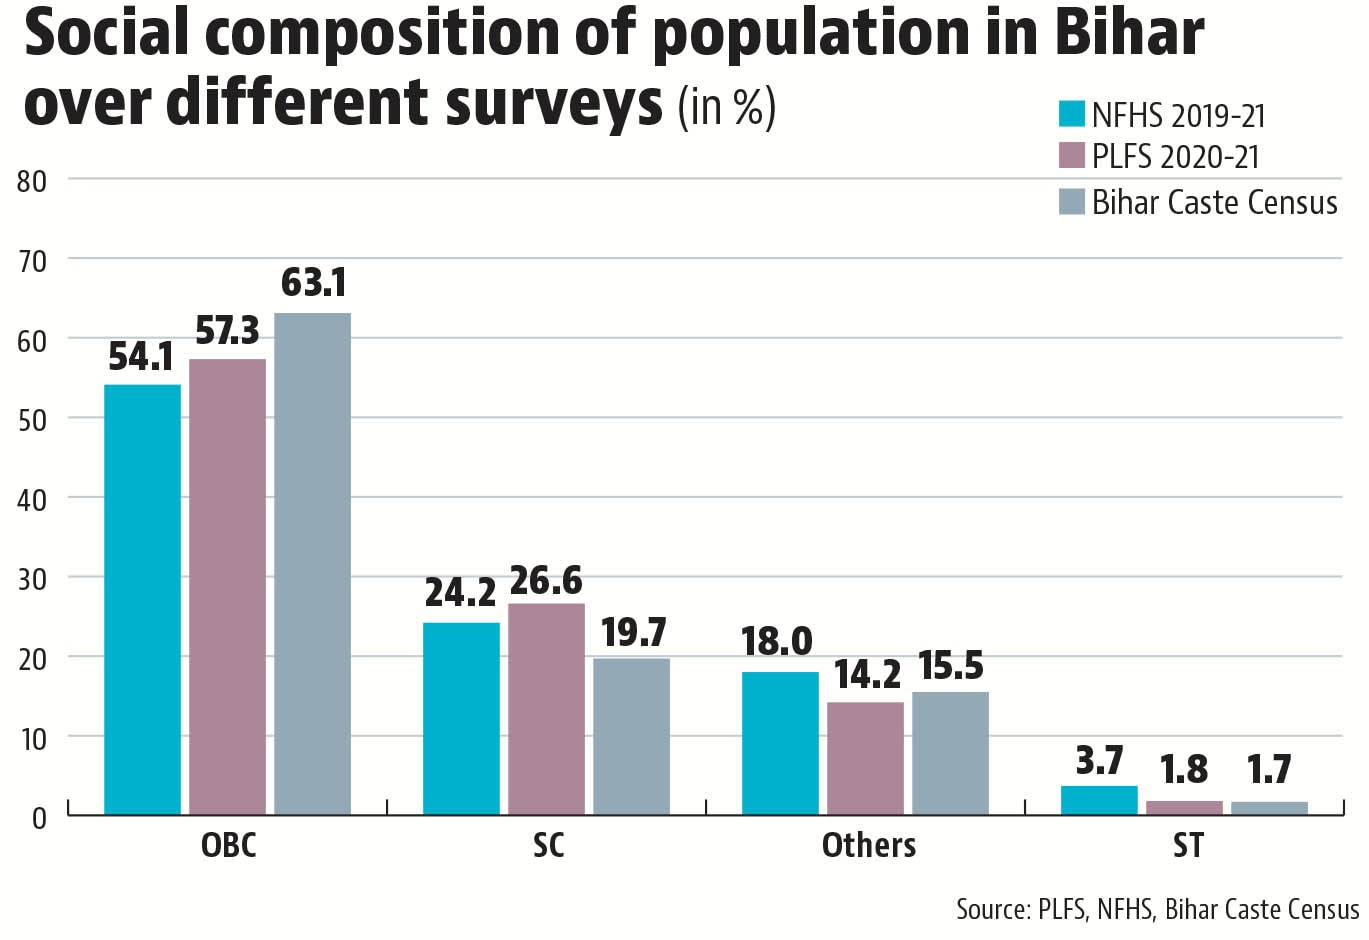
The Bihar government announced the subcaste-wise population numbers from its caste census on Monday. The most important number from the results is that other backward classes (OBCs) – they are divided into backward classes (BCs) and extremely backward classes (EBCs) in Bihar – have a share of 63% in the state’s population. To be sure, the caste census is likely to have much more data than the subcaste-wise population numbers and it remains to be seen when they are released. Until that happens, what are the key takeaways from the data which has been published on October 2? Here are four charts which answer this question.

The charts that matter
 OBC population share of 63% is not surprisingBihar’s caste census is the first-of-its-kind exercise after the 1931 census which enumerated subcastes. India’s decadal census since then has only gathered data on the share of Scheduled Castes (SC) and Scheduled Tribes (ST) in the population. While a lot of voices demanding caste census have argued that we know nothing about the population share of OBCs, this newspaper has always argued that this number is not exactly unknown. This is because various government surveys publish data on the share of OBCs and non-SC/ST/OBC population. Data from the 2019-21 National Family and Health Survey (NFHS) or the Periodic Labour Force Surveys (PLFS), for example, shows that OBCs had a share of almost 55% in Bihar’s population.
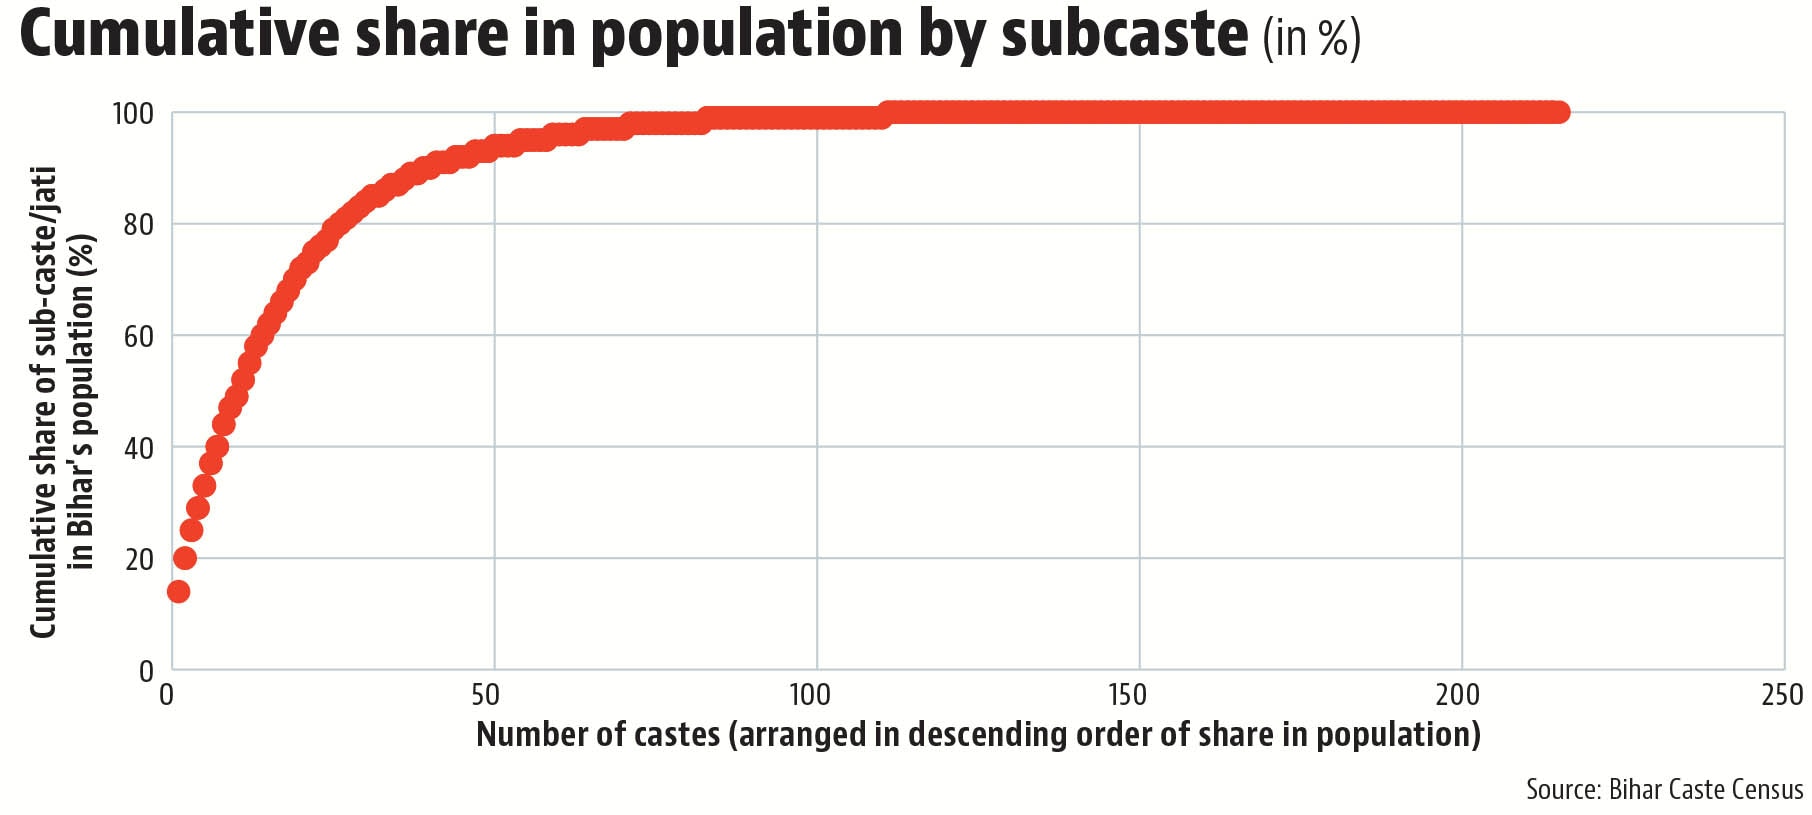
- Bihar’s social composition is not as fragmented as the number of subcastes in the caste survey results suggestThe subcaste schedule for the Bihar caste survey includes 215 subcastes. This would suggest a very large degree of social fragmentation in the state of Bihar. HT’s analysis of the subcaste-wise population numbers given in the caste census results shows that this is not the case. Just 10 subcastes out of the 215 have a cumulative share of 50% in the state’s population and this number increases to 80% for the top 26 subcastes by population share. There are 190 subcastes which have a population share of less than 1%.
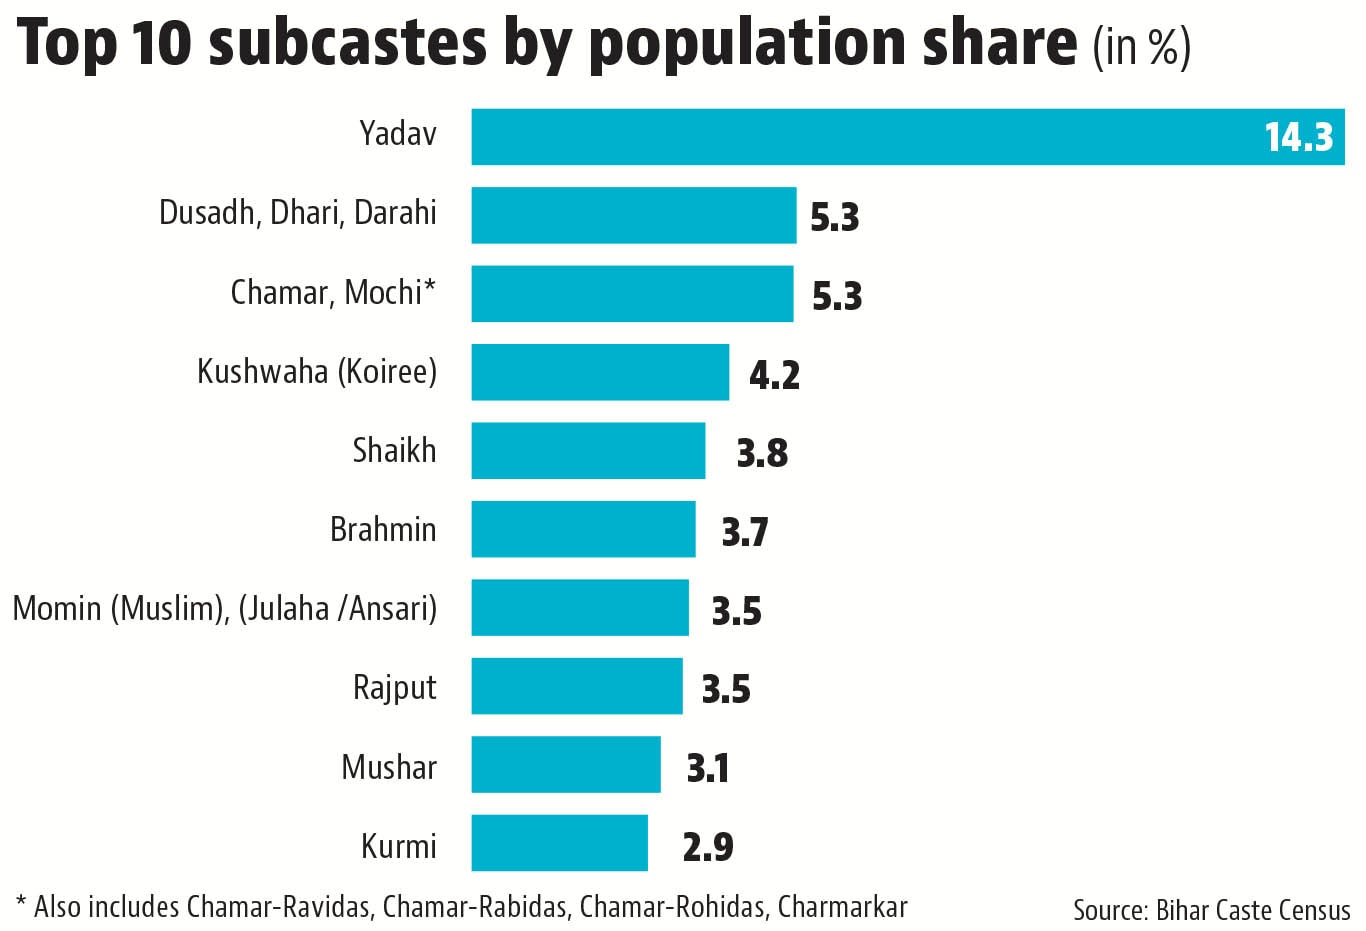
- Yadavs are the most dominant subcaste in BiharThis is perhaps the most important political takeaway from the results. While Yadavs have always been believed to be a numerically dominant subcaste in Bihar, the results show that with a share of almost 15% in the state’s population, not only are they significantly ahead of the Hindu upper castes (10.6%) in the state, they are almost at par with Muslims (17.7%) and the scheduled caste population (19.7%). The population share of Yadavs is more than the combined share of all other BCs in the state. The subcastes which have the second and third largest share in population in the state are Dusadhs and Chamars from the SC category. They are followed by Kushwaha (Koiree) in the BC category.
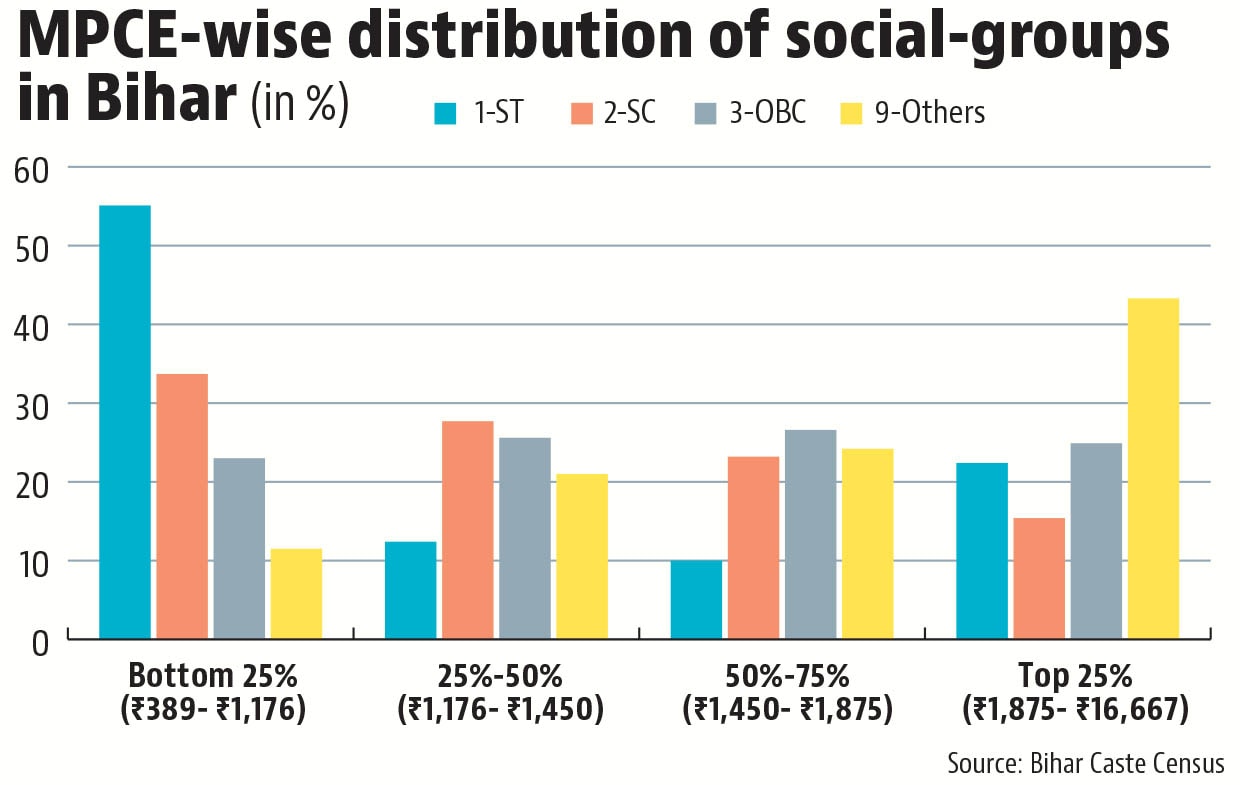
- What the caste survey data does not tell usWhile the caste survey results do give us subcaste-wise population shares for the first time after the 1931 Census, the vast difference between the population shares of various subcastes within the OBC category raises the question of intra-OBC difference in socio-economic status. Given the fact that Bihar has already been following a division of BC and EBCs among OBCs, this question is even more pertinent. Data from sources such as PLFS shows that there is a wide variation in consumption spending within OBCs and unless the caste census publishes data on socio-economic indicators for subcastes – the schedule sought information on educational status, nature of employment, asset ownership, income etc. – the question whether OBC leaders can claim this 63% as a homogeneous block and whether this claim will have political resonance will remain unanswered.