E-Paper



Four things to learn from the first-ever CUET results
An HT analysis of the preliminary results fact sheet released by NTA gives important insights into the exam.

 Prefer HTon Google


The results of the first Common University Entrance Test (CUET) were announced early on Friday. CUET, which has been conducted by the National Testing Agency (NTA), promises to be a game-changer for undergraduate and postgraduate admissions in India, and NTA has been exploring the idea of subsuming other entrance examinations within it as well. This makes the first CUET experience an important one. An HT analysis of the preliminary results fact sheet released by NTA gives important insights into the exam.

Only a small fraction of the students who finished school seem to take the test
According to the CUET fact sheet, a total of 990,469 unique candidates registered. To be sure, many of them registered for multiple subjects. Out of those, only 626,490 unique candidates appeared in CUET. How representative is this number when it comes to the number of students who would have successfully finished their Class 12 exams this year? While the exact number of the students who passed Class 12 this year is difficult to get, ballpark estimates suggest that only a small fraction of such students took CUET.
The Unified District Information System for Education Plus (UDISE+) report for 2020-21 – it is released by the Union ministry of education – says that there were 26.9 million students in higher secondary (Class 11 and 12) in India. Even if one were to assume that only 20% of them successfully finished Class 12 in 2021-22 (this is likely an underestimate), the number would come to around 5.4 million. With just under a million students taking CUET this year, it shows that a large majority of those who passed Class 12 opted to not take the test. Of course, this cannot be a basis to say that demand for higher education has fallen after the introduction of CUET. Many students who finish higher education do not pursue admissions, while many more will likely take admissions without a CUET score.

English was the most common subject, with Physics, Chemisty and Maths (PCM) close behind
In terms of the number of candidates who took the test in each subject, English had the maximum participation with 485,894 tests being administered. This was followed by General Test (450,635), Chemistry (231,970), Mathematics (229,793), and Physics (220,014).
NTA has already shared the results of candidates in each subject with the universities where the candidates applied. Now the universities will prepare their merit lists using the normalised scores. The universities will then consider the “best of three” or “best of four” marks as they have been doing under the cut-off-based admission process.

English also seems to have the maximum share of students who aced the test
Of the nearly 2.9 million tests taken by 990,000 students in CUET this year, a total of 21,159 attained a 100-percentile score. Among these, English alone accounted for nearly 39% of all 100-percentile scores. To be sure, it also saw the maximum number of students appear for the test (as stated above), accounting for 17% of all tests given in CUET.
Among subjects that saw more than 1,000 tests being administered, Sanskrit (23.3%) had the highest proportion of test-takers getting a 100-percentile score. It was followed by Tamil (11.3%), Psychology (6%), Political Science (2%) and Urdu (1.7%). At the other end of the spectrum, candidates in General Test (0.01%), Physics (0.03%), and Mathematics (0.04%) had the lowest success rates in terms 100-percentile scores.

Delhi-Woman-General seems like the modal topper combination
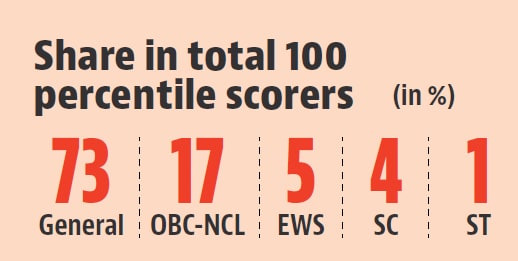
Of the 21,159 students who have scored in the top percentile in various subjects, 60% are women. This is 17 percentage points more than the share of unique women students who registered for CUET. When it comes to social background, the relative share of general candidates – this includes candidates who do not belong to the Scheduled Caste, Scheduled Tribe, Non-Creamy Layer of the Other Backward Classes and Economically Weaker Sections – is significantly higher than that of anybody else.
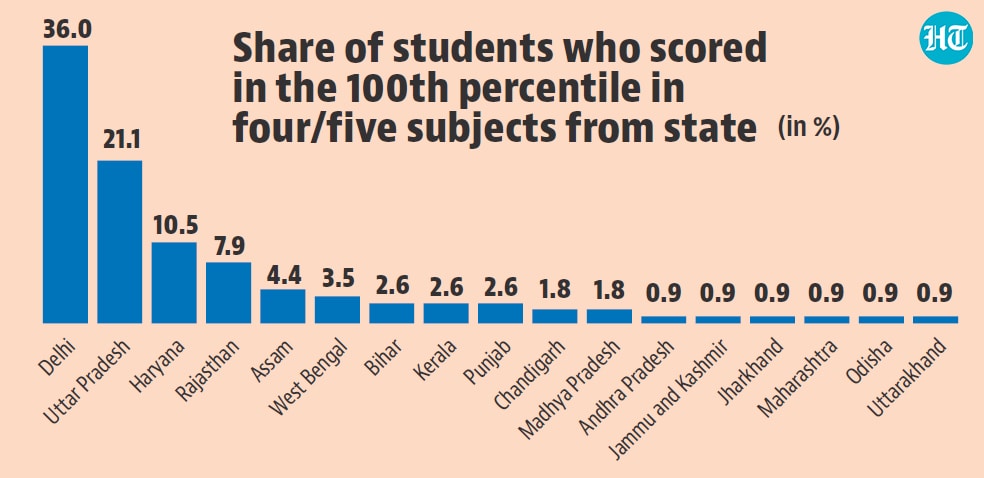
The list of candidates who have scored 100th percentile in four or five subjects has been given in an annex to the CUET fact sheet. The prefix with roll number of candidates can be used to find out the state of these students. It shows that the largest number of the 114 candidates who have achieved this feat, are from Delhi.