India’s trade deficit in November stood at a record $22.9 billion, the commerce ministry said on December 14, in sharp contrast to a trade surplus in June 2020. How do we explain this dramatic change? Here are four charts to explain it in detail.
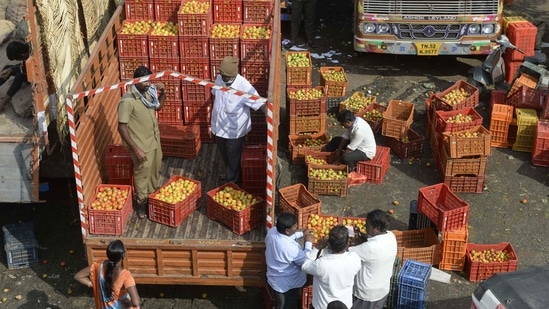
For most of the top 10 items in India’s import and export basket, which account for 80% and 61% of total imports and exports, unit values have increased significantly between April and October 2021 compared to the same period last year. (AFP )
Imports suffered a bigger disruption than exports
A comparison of India’s merchandise export and import numbers shows there was a bigger disruption in imports during the early phase of the pandemic. Imports fell to $17.09 billion in April 2020, the lowest in 11 years.
Given that most of India’s imports are in the intermediate and capital goods category – the World Bank’s WITS database shows these two had a share of 54% in India’s imports in 2019-20 – imports started rising sharply as the economy opened up.
Although exports have increased in the post-pandemic period, the rise is smaller.
Is the import spike just a result of rise in crude oil prices?
Unlike GDP, trade numbers are measured in nominal terms. It means they are affected by changes in prices of important commodities.
One commodity that plays a large role in the volatility in India’s import bill is crude petroleum. The country imports more than 80% of its crude oil, and its prices have fluctuated wildly during the pandemic.
The price of India’s crude oil basket (COB) fell from $54.63 per barrel in February 2020 to just $19.90 a barrel in April 2020. It was less than $50 per barrel for the next eight months, a level not seen in the past three years, before climbing once again.
Average COB price was $80.64 per barrel in November 2021. Are petroleum prices the biggest reason for rise in India’s import bills? Not entirely, as non-petroleum imports have also shown a large increase.
But inflation has played a major role in boosting both import and export numbers
Post-pandemic inflation has not been confined to petroleum alone, with most countries clocking high rates of overall inflation and also a rise in prices of non-food, non-fuel items. This has played a role in India’s trade numbers as well.
Trade in different commodities in October 2021, as seen in the commerce ministry’s latest data, shows this clearly, according to HT’s analysis.
For most of the top 10 items in India’s import and export basket, which account for 80% and 61% of total imports and exports, unit values have increased significantly between April and October 2021 compared to the same period last year.
Dependence on Chinese import increases
India’s imports from China have also increased in the current year. Despite calls for boycott of Chinese products from time to time, imports from that country between April and October showed an annual increase of 52% to $51 billion.
These imports are also 22% higher compared to the pre-Covid period in 2019-20. To be sure, non-Chinese imports between April and October have also seen 82% yearly growth.
However, non- Chinese imports in current year are only 14% higher compared to a similar period in 2019-20.
India’s exports to China in 202-21 have grown by 16% to $14 billion, compared to last year while non-Chinese exports grew by 59%.
The continuous increase in the trade deficit due to increasing import bills could affect India’s economic recovery after the pandemic, as a rising deficit lowers GDP.
The share of trade deficit in India’s GDP was 1.27% in 2020-21, the lowest since 2017-18. It was mainly due to a fall in import bills as crude prices crashed in the initial months of the pandemic.
With the rise in crude oil prices this year, as well as higher non-crude imports, the negative impact of trade deficit on GDP is likely to grow.
Get the latest India News, breaking headlines and real-time updates from across the country. Stay informed about politics, government policies, crime, weather and major national developments.

 E-Paper