E-Paper



Number Theory: Five charts that explain India’s inflation situation
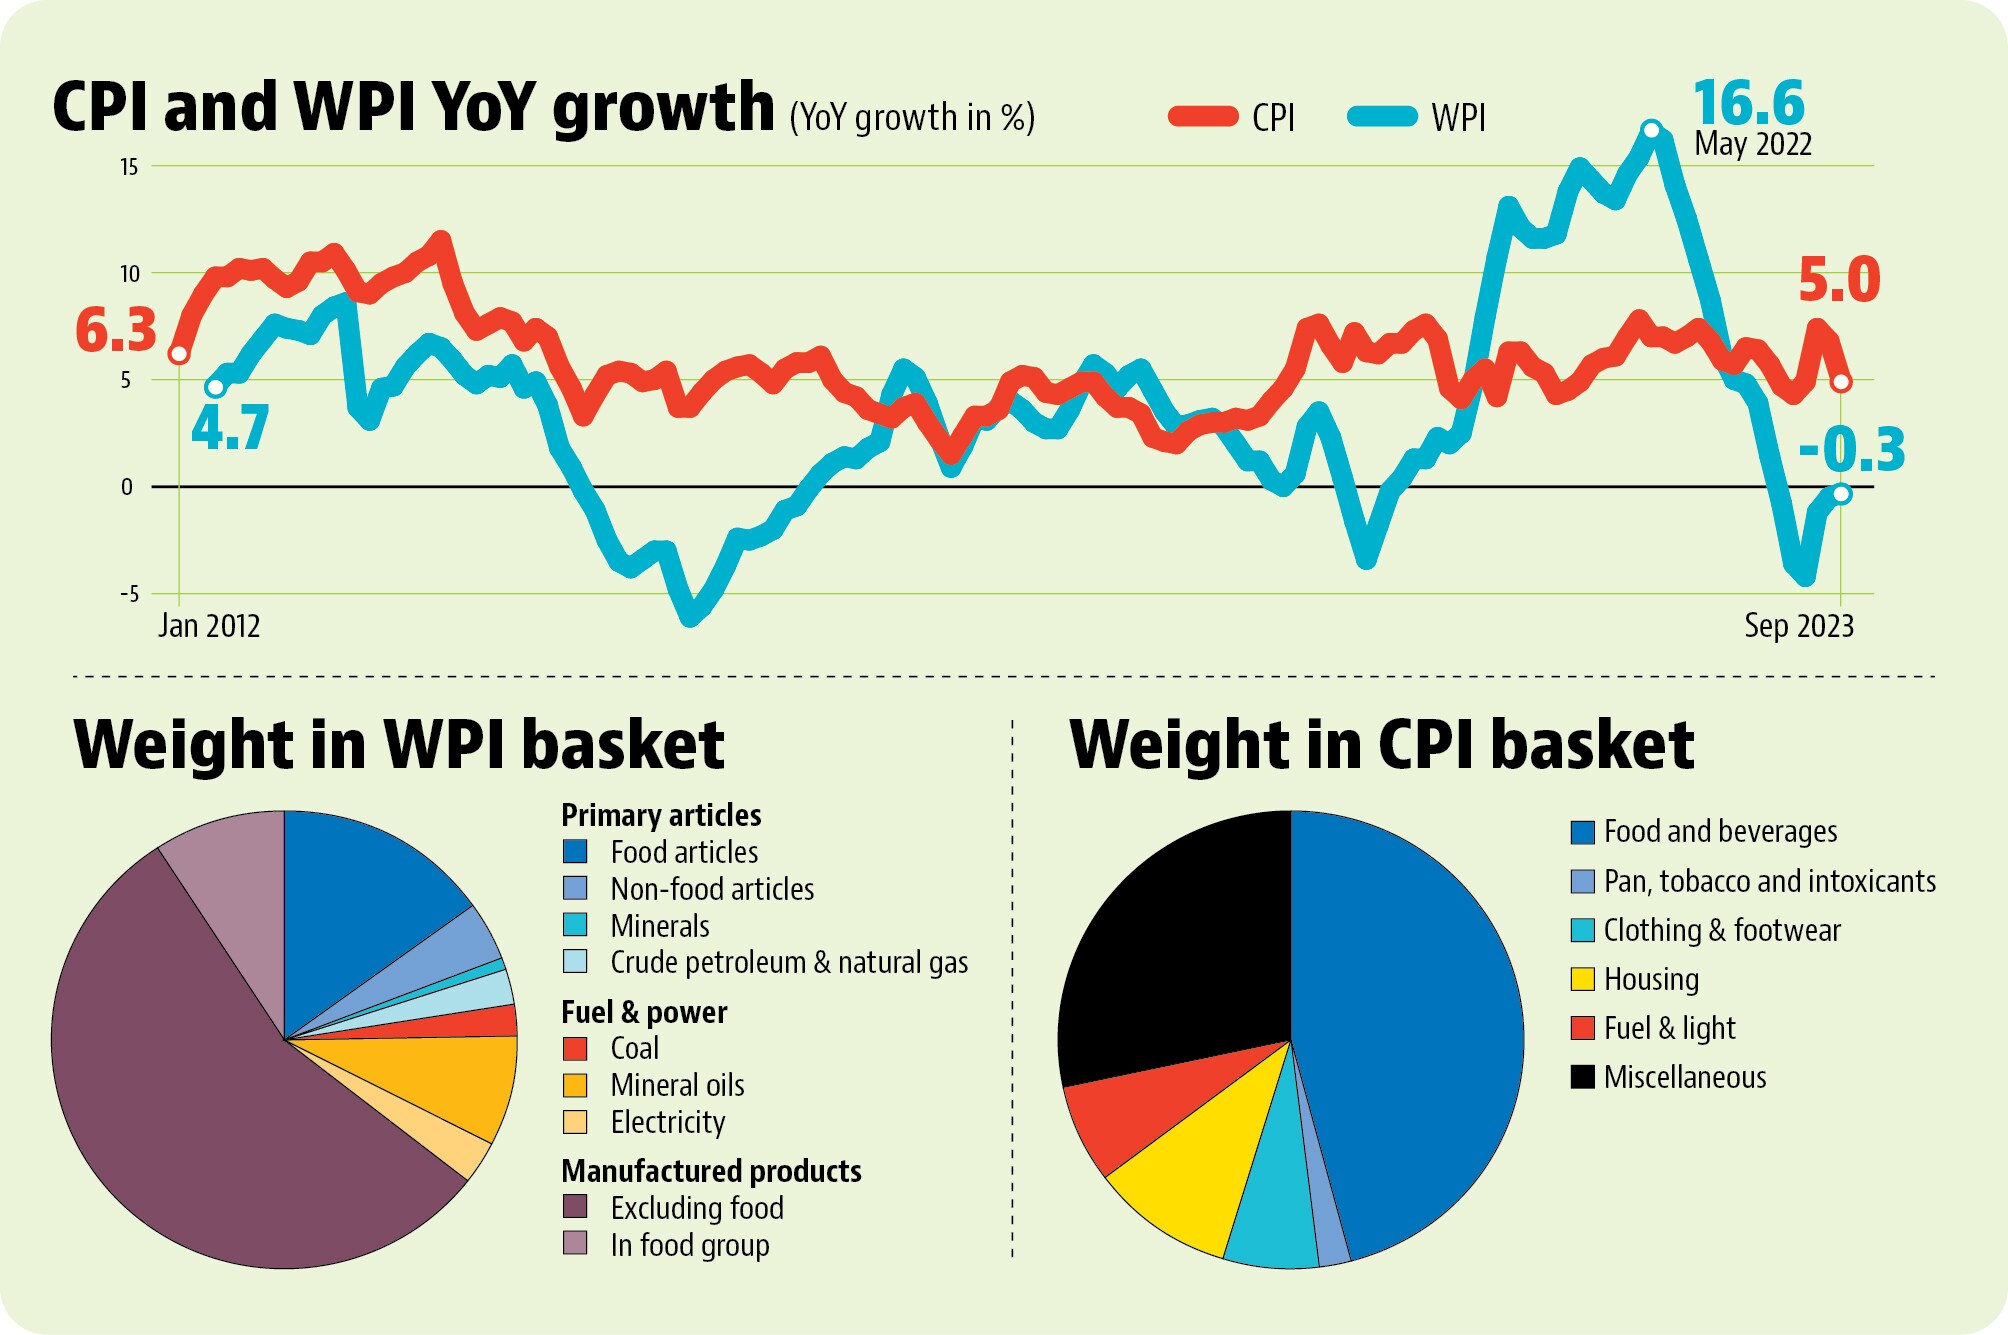
Wholesale inflation, as per Wholesale Price Index (WPI) data released by the Ministry of Commerce and Industry on October 16, contracted by 0.26% in September
Published on: Oct 18, 2023, 09:24:48 IST


Share via


Copy link

India’s benchmark inflation rate, as measured by the Consumer Price Index (CPI) was 5% in September, as per data released by the National Statistical Office (NSO) on October 12. What do these numbers tell us about the overall inflation situation in the Indian economy? Here are five charts which answer this question in detail.

Five charts that explain India’s inflation situation
 What explains the divergence in two inflation numbers?CPI and WPI numbers, as the names might suggest, do not track prices of similar commodities in retail and wholesale markets. The commodity composition of these two indices is very different as the former is meant to track the average consumption basket of a household and the latter is designed to as a producer price index in India. This means that CPI has a much larger weight for food items, has services consumed by households and does not have industrial inputs such as metals, unlike WPI. This basic difference is often forgotten while reading the two inflation numbers.
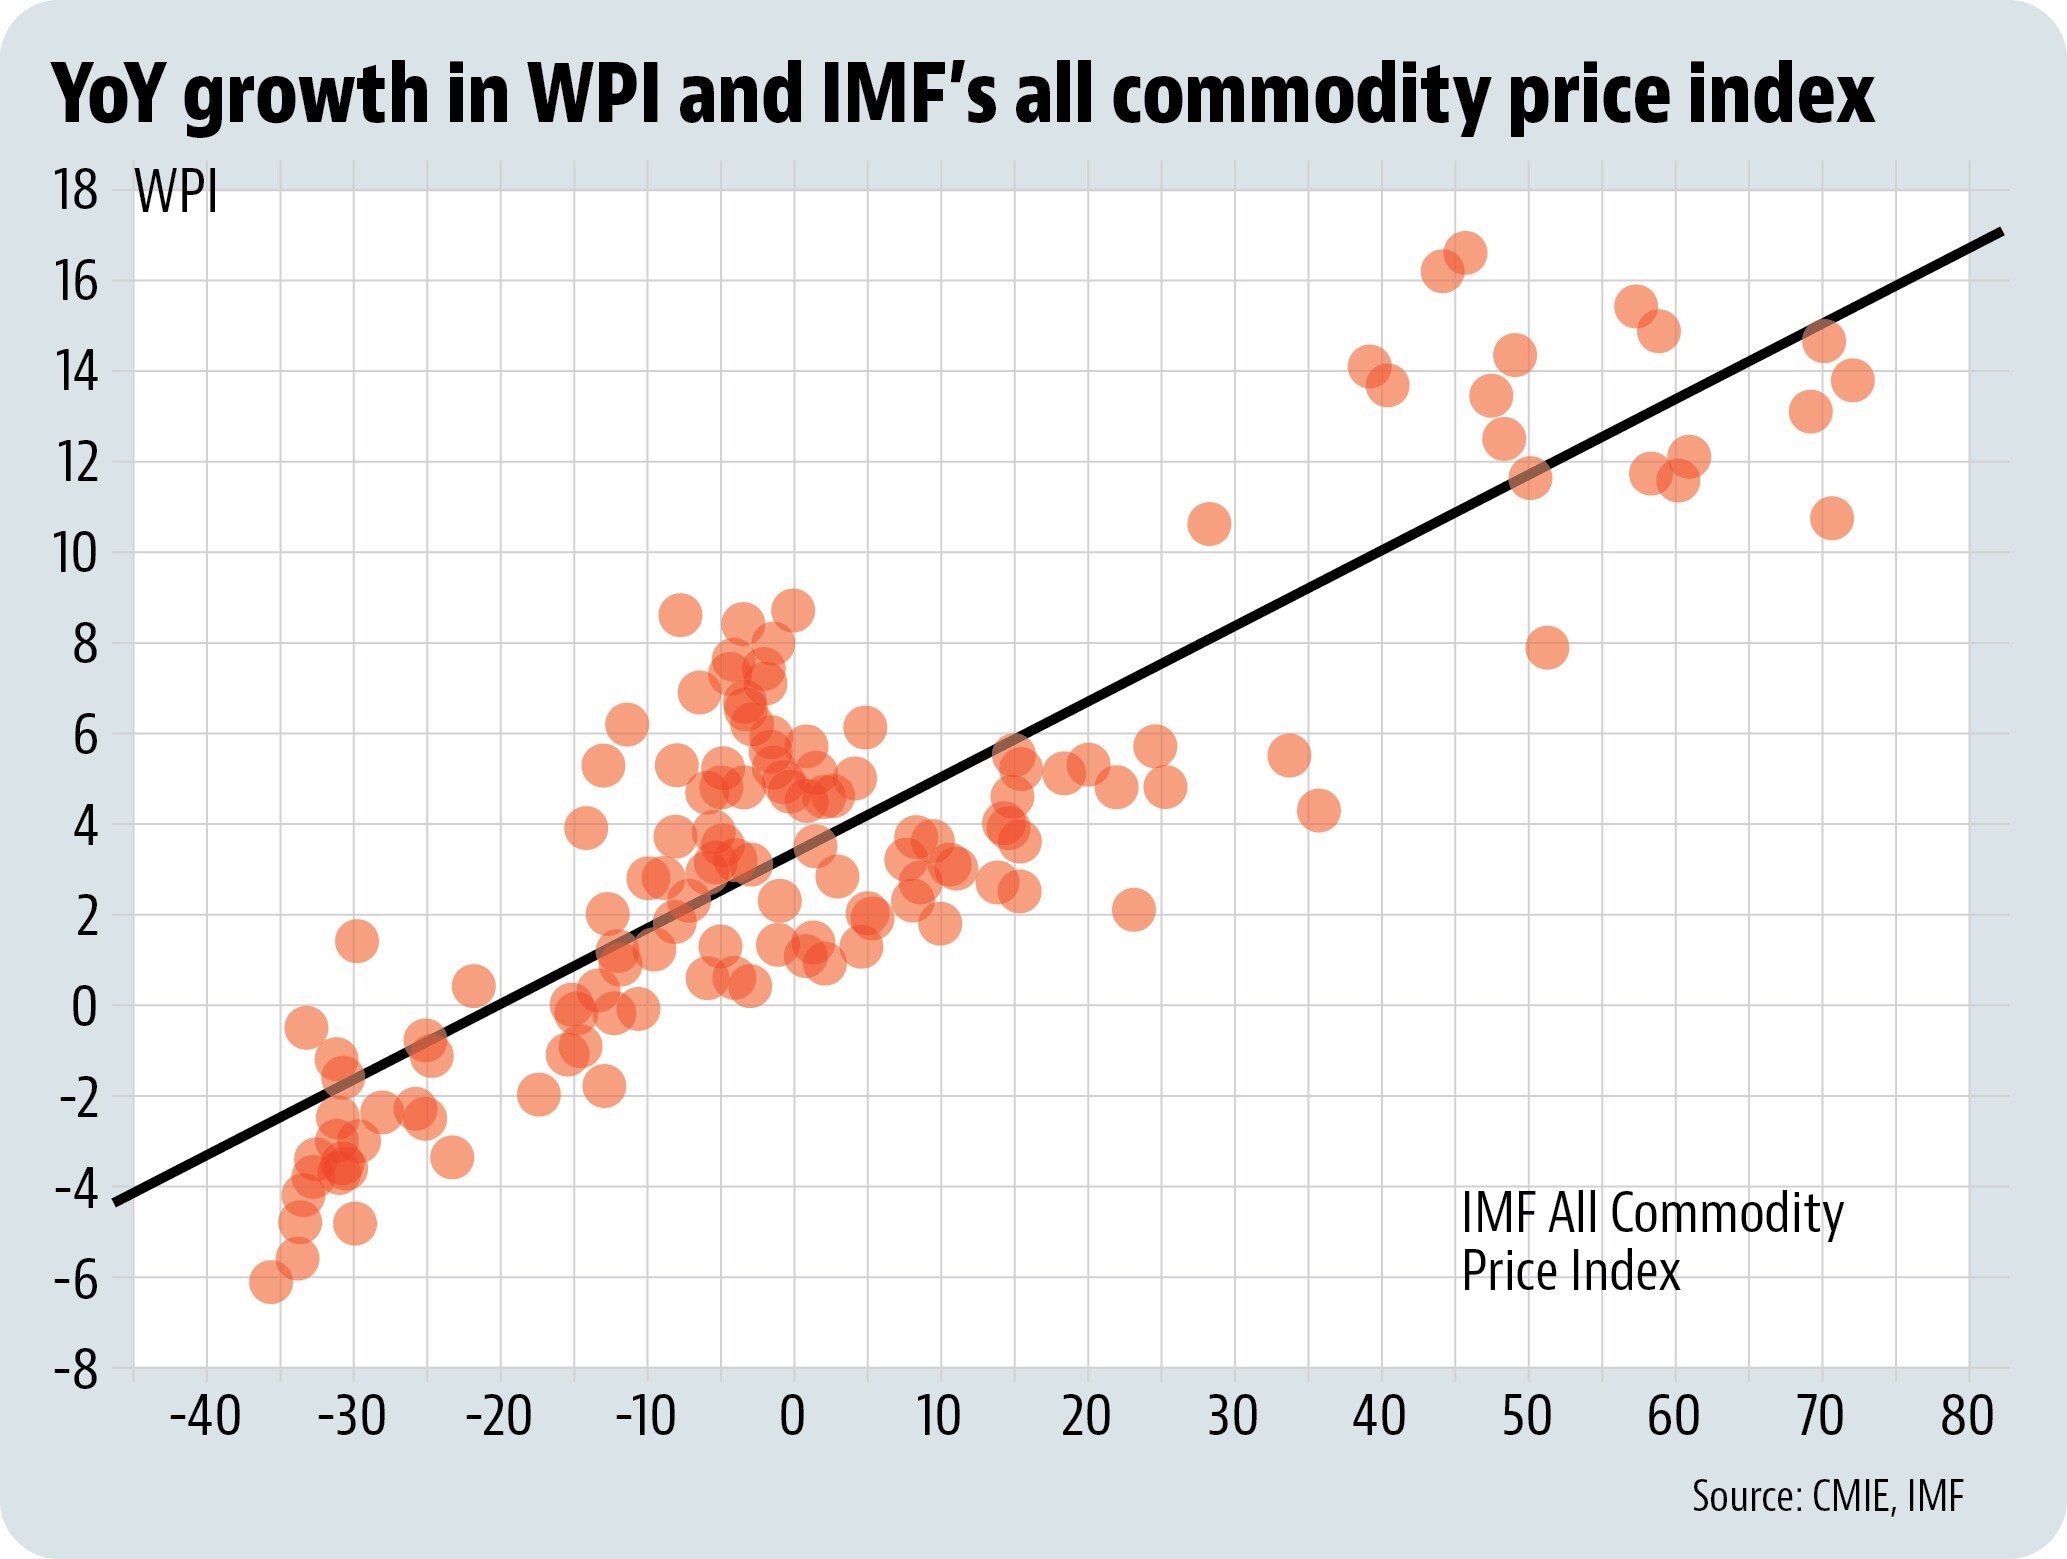
- In fact, WPI’s trend is in keeping with the movement in international commodity pricesIf one were to compare the trend, not magnitude, wholesale inflation in India closely tracks the inflation in international commodity prices. This can be clearly seen if one compares year on year change in WPI and IMF’s all commodity price index which includes both fuel and non-fuel prices.
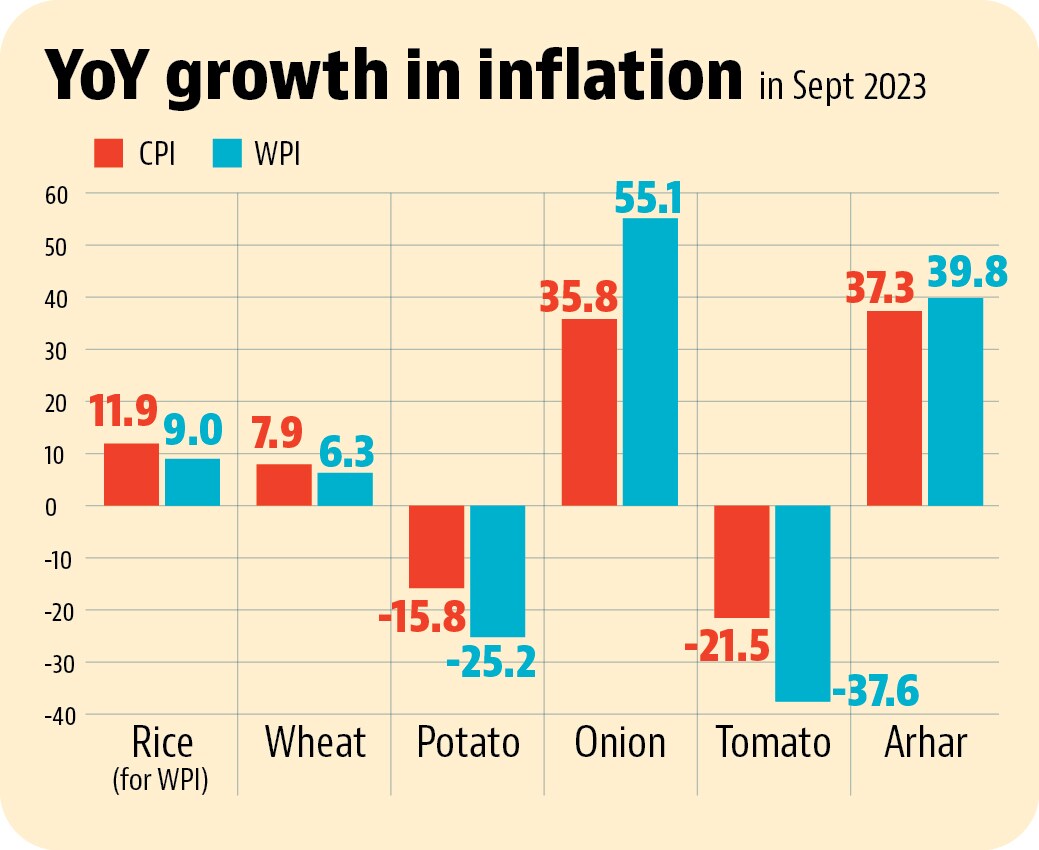
- However, comparable sub-categories of CPI and WPI move in tandemThe difference in headlines numbers on account of composition of the two indices notwithstanding, retail and wholesale prices of individual items do move in tandem. And this is where both CPI and WPI show the common area of concern in the price of non-perishable food items. While inflation for vegetables has been falling, it continues to be a cause for concern for cereals such as wheat and rice and pulses. While prices of non-perishable food items might not drive up the headline inflation numbers – RBI’s Monetary Policy Committee (MPC) expects CPI inflation to fall from 6.2% in quarter ending September 2023 to 5.6% and 5.2% in the quarters ending December 2023 and March 2023 – they will put pressure on budgets of poor households given the dominance of food items in the consumption basket of the poor. With less than six months to go for the general elections a spike in inflation for key food items can become a problem for the government.
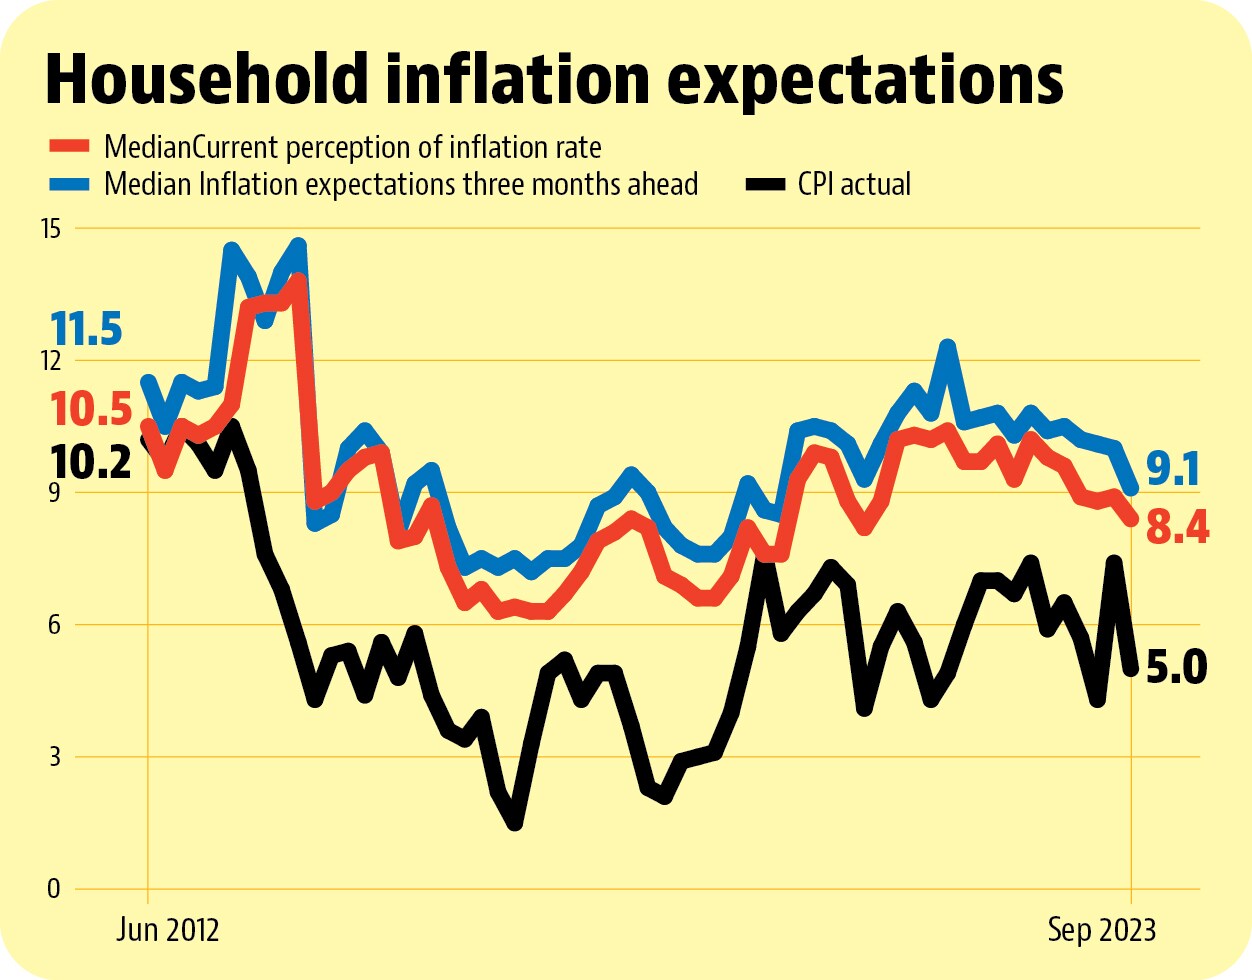
- A spike in food inflation could reverse the falling trajectory of inflation expectationsIndia’s inflation targeting framework requires RBI to keep inflation at 4% plus minus two percent. This also means that monetary policy has to be forward looking in nature which makes inflation expectations extremely important. Data from RBI’s inflation expectation survey of households shows that both current perception and future (three-month ahead) perception of inflation has come down significantly compared to what it was two years ago. “The MPC will remain resolute in its commitment to aligning inflation to the target and anchoring inflation expectations”, the MPC’s latest resolution said, which shows that the central bank still considers containing inflation expectations as a work in progress.