E-Paper



Number Theory: How sea surface temperatures broke records in 2023
Sea surface temperatures are important because sea temperature is among the big drivers of global climate


Data from Copernicus Climate Change Service (C3S) of the European Centre for Medium-Range Weather Forecasts (ECMWF) has confirmed that 2023 was the warmest ever year on record and by a big margin. Other global temperature datasets are almost certain to confirm this trend, too. This was accompanied with another worrying trend in 2023: the highest recorded sea surface temperatures (SSTs). This is important because sea temperature is among the big drivers of global climate. Warmer oceans lead to more water vapour in the atmosphere, which feeds weather events such as rainfall, snowfall, and cyclones. It is obvious that big changes in SST will also affect the survival and migration patterns of marine life, which ultimately affects human life too. Here are four charts that describe SST trends in 2023.

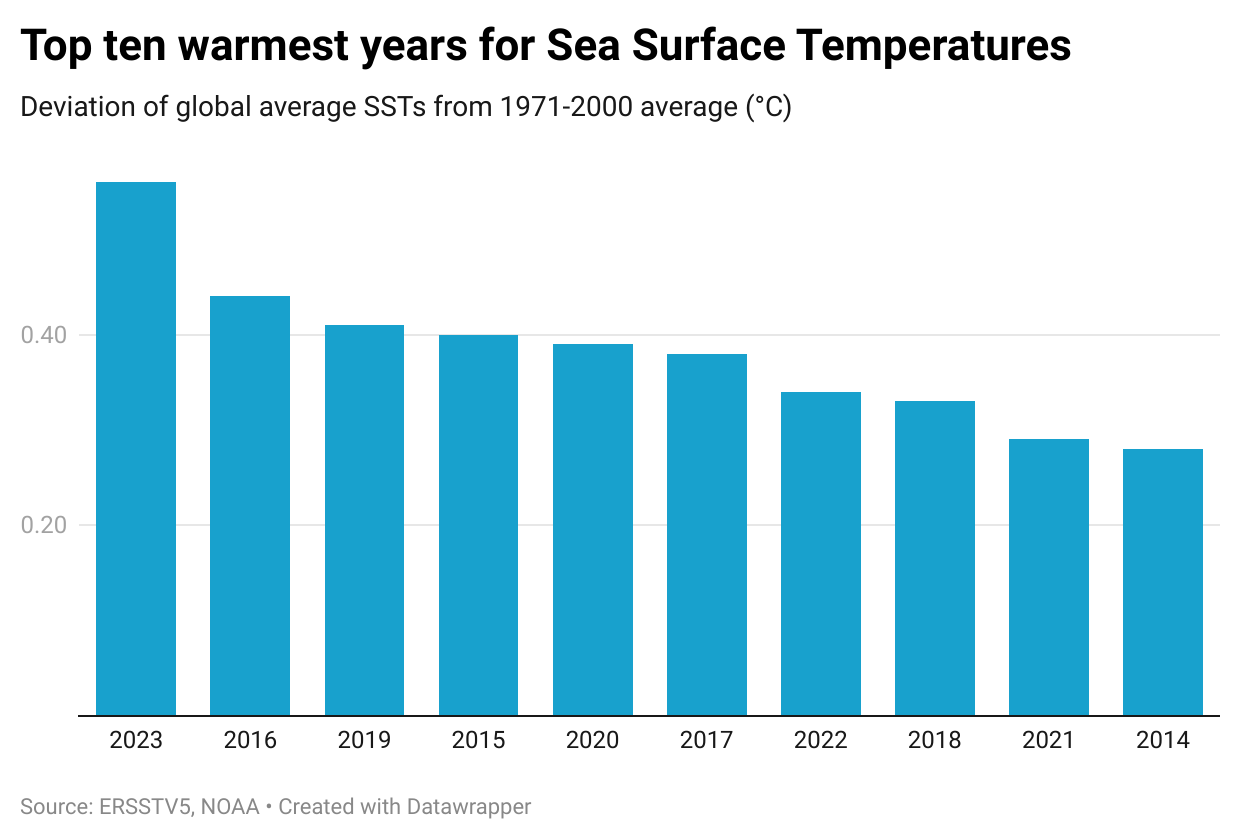
 Previous records left far behind in SSTs tooAs HT reported on January 11, global average temperature left previous records far behind in 2023. It is not always necessary that SSTs follow this trend. For example, 2020 is either recorded as the third warmest year by global average temperature or tied for the second spot with 2016. However, it is only the fifth warmest year by global average of SSTs. This is because the temperature that is reported usually is the temperature human beings experience, that of the air just above the earth’s surface. SST, on the other hand, is the temperature of the water at the surface of the world’s oceans. However, in 2023, SSTs were also the highest ever by a big margin. The global average SST in 2023 was 0.56°C above the 1971-2000 baseline, according to the Extended Reconstructed Sea Surface Temperature Version 5 (ERSST5) data of the United States National Oceanic and Atmospheric Administration (NOAA). This is 0.13°C warmer than 2016, the second warmest year by global SST average. In comparison, 2016 was just 0.03°C warmer than the third warmest year (2019) and 0.16°C warmer than the tenth warmest year (2014).
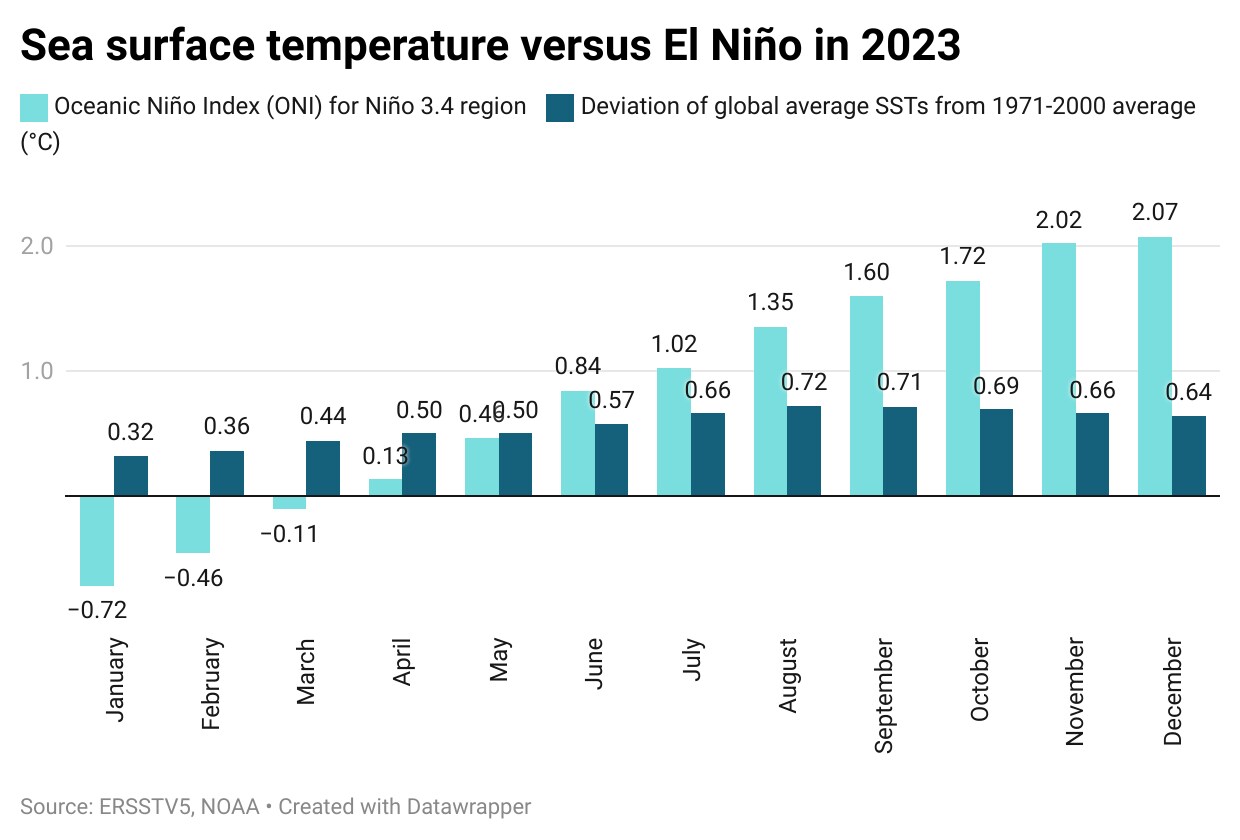
- SSTs reached record levels just as La Nina endedMonthly values of SSTs show that ocean warming started breaking records in 2023 only in April. Warming in SSTs from January to March was ranked “only” fifth, fifth, and third highest for those months. On the other hand, every month from April onward was the warmest ever in 2023. Part of this is because of a natural and cyclical pattern in SSTs. The equatorial Pacific Ocean heats up and cools down in a natural cycle every few years. The cyclical warming is called El Nino and the cyclical cooling is called La Nina. While the index that measures this cycle was neutral from February to May (values between -0.5 and 0.5), it turned positive in April on its way to El Nino. This likely helped April 2023 in recording its highest ever SST. As a full-blown El Nino developed in June, the warming in SSTs strengthened. SST warming has been more than 0.50°C compared to the 1971-2000 average every month from June.
- Man-made global warming is responsible for long-term SST warming2023 was expected to be a warm year for SSTs because of the El Nino-La Nina cycle described above. However, the degree of warming in 2023 shows that this natural cycle alone cannot be responsible for the unusually high SSTs . As the first chart makes it clear, 2023 is far ahead of all years, which also puts it ahead of all El Nino-affected years. On the other hand, long-term averages of SSTs have been increasing consistently and faster than earlier since the 1970s, suggesting that greenhouse gas emissions are a big driver of this change.
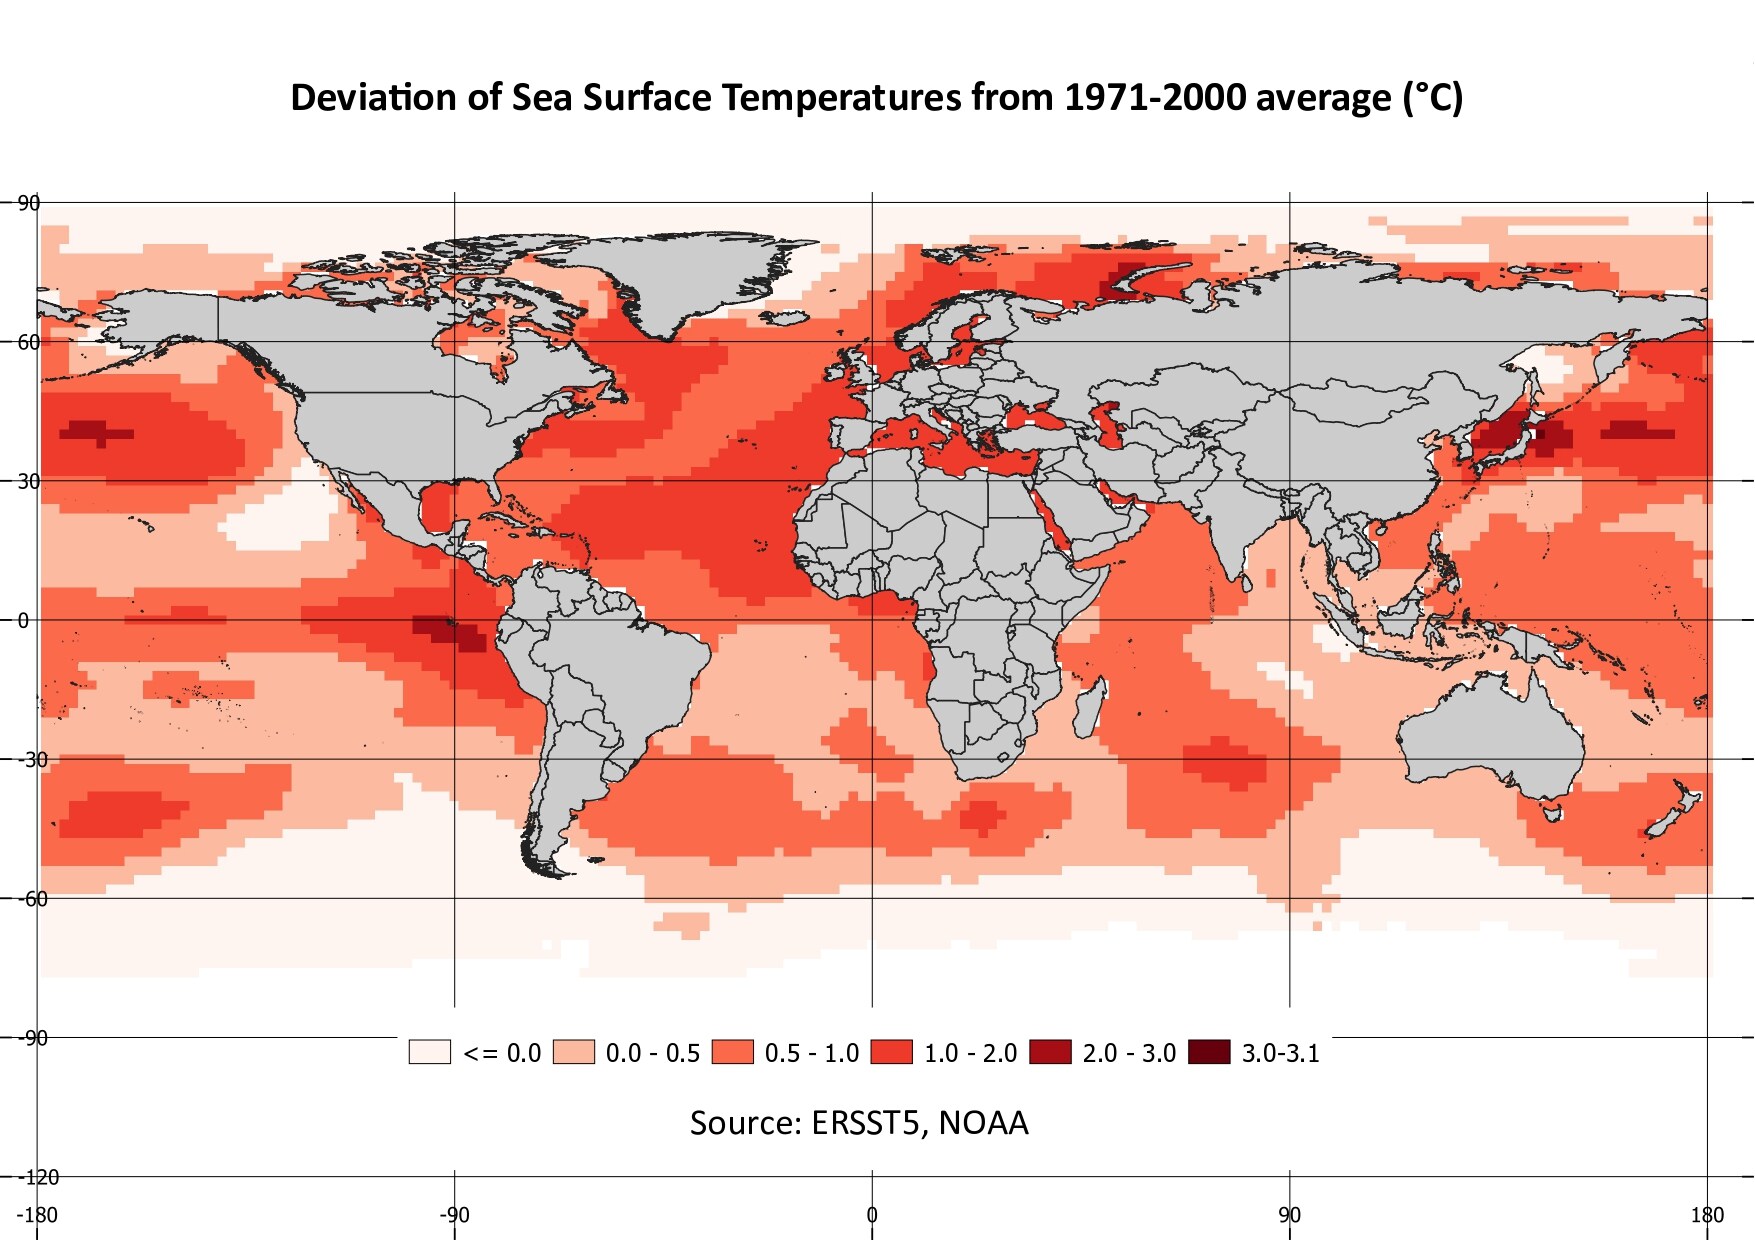
- But a change in shipping fuels likely added a temporary spike in 2023To be sure, scientists have suggested that part of the reason for the big spike in 2023 is a measure taken for controlling air pollution. The International Maritime Organisation restricted the use of sulphur in marine fuels in 2020. Because sulphur-related emissions have a localised cooling effect (because it reflects sunlight) scientists believe it added a temporary spike on top of long-term human-induced global warming and natural cycles in SSTs. This was suggested in an analysis by, among others, Robert Rhode, Lead Scientist at Berkeley Earth, a US-based non-profit working on environmental data. The temporary spike from the restriction on sulphur can be seen in the high warming recorded in the North Atlantic Ocean in 2023 – a busy shipping route – apart from the equatorial Pacific Ocean.