E-Paper



Number Theory: The other side of caste and economic inequality
The analysis on October 4 showed that non SC-ST-OBC workers have a higher relative share in not just salaried but also high income salaried jobs.
Published on: Oct 5, 2023, 08:19:57 IST


Share via


Copy link

Yesterday, an analysis published in these pages used data from the Periodic Labour Force Survey (PLFS) to show that Indians who do not belong to Scheduled Caste (SC), Scheduled Tribe (ST) or Other Backward Classes (OBC) are richer than their SC-ST-OBC peers.

While these numbers clearly establish a link between caste and economic status, it will be a big mistake to assume that caste is the only structural factor driving economic inequality in India. Here are three charts which explain this argument in detail.
The other side of caste and economic inequality
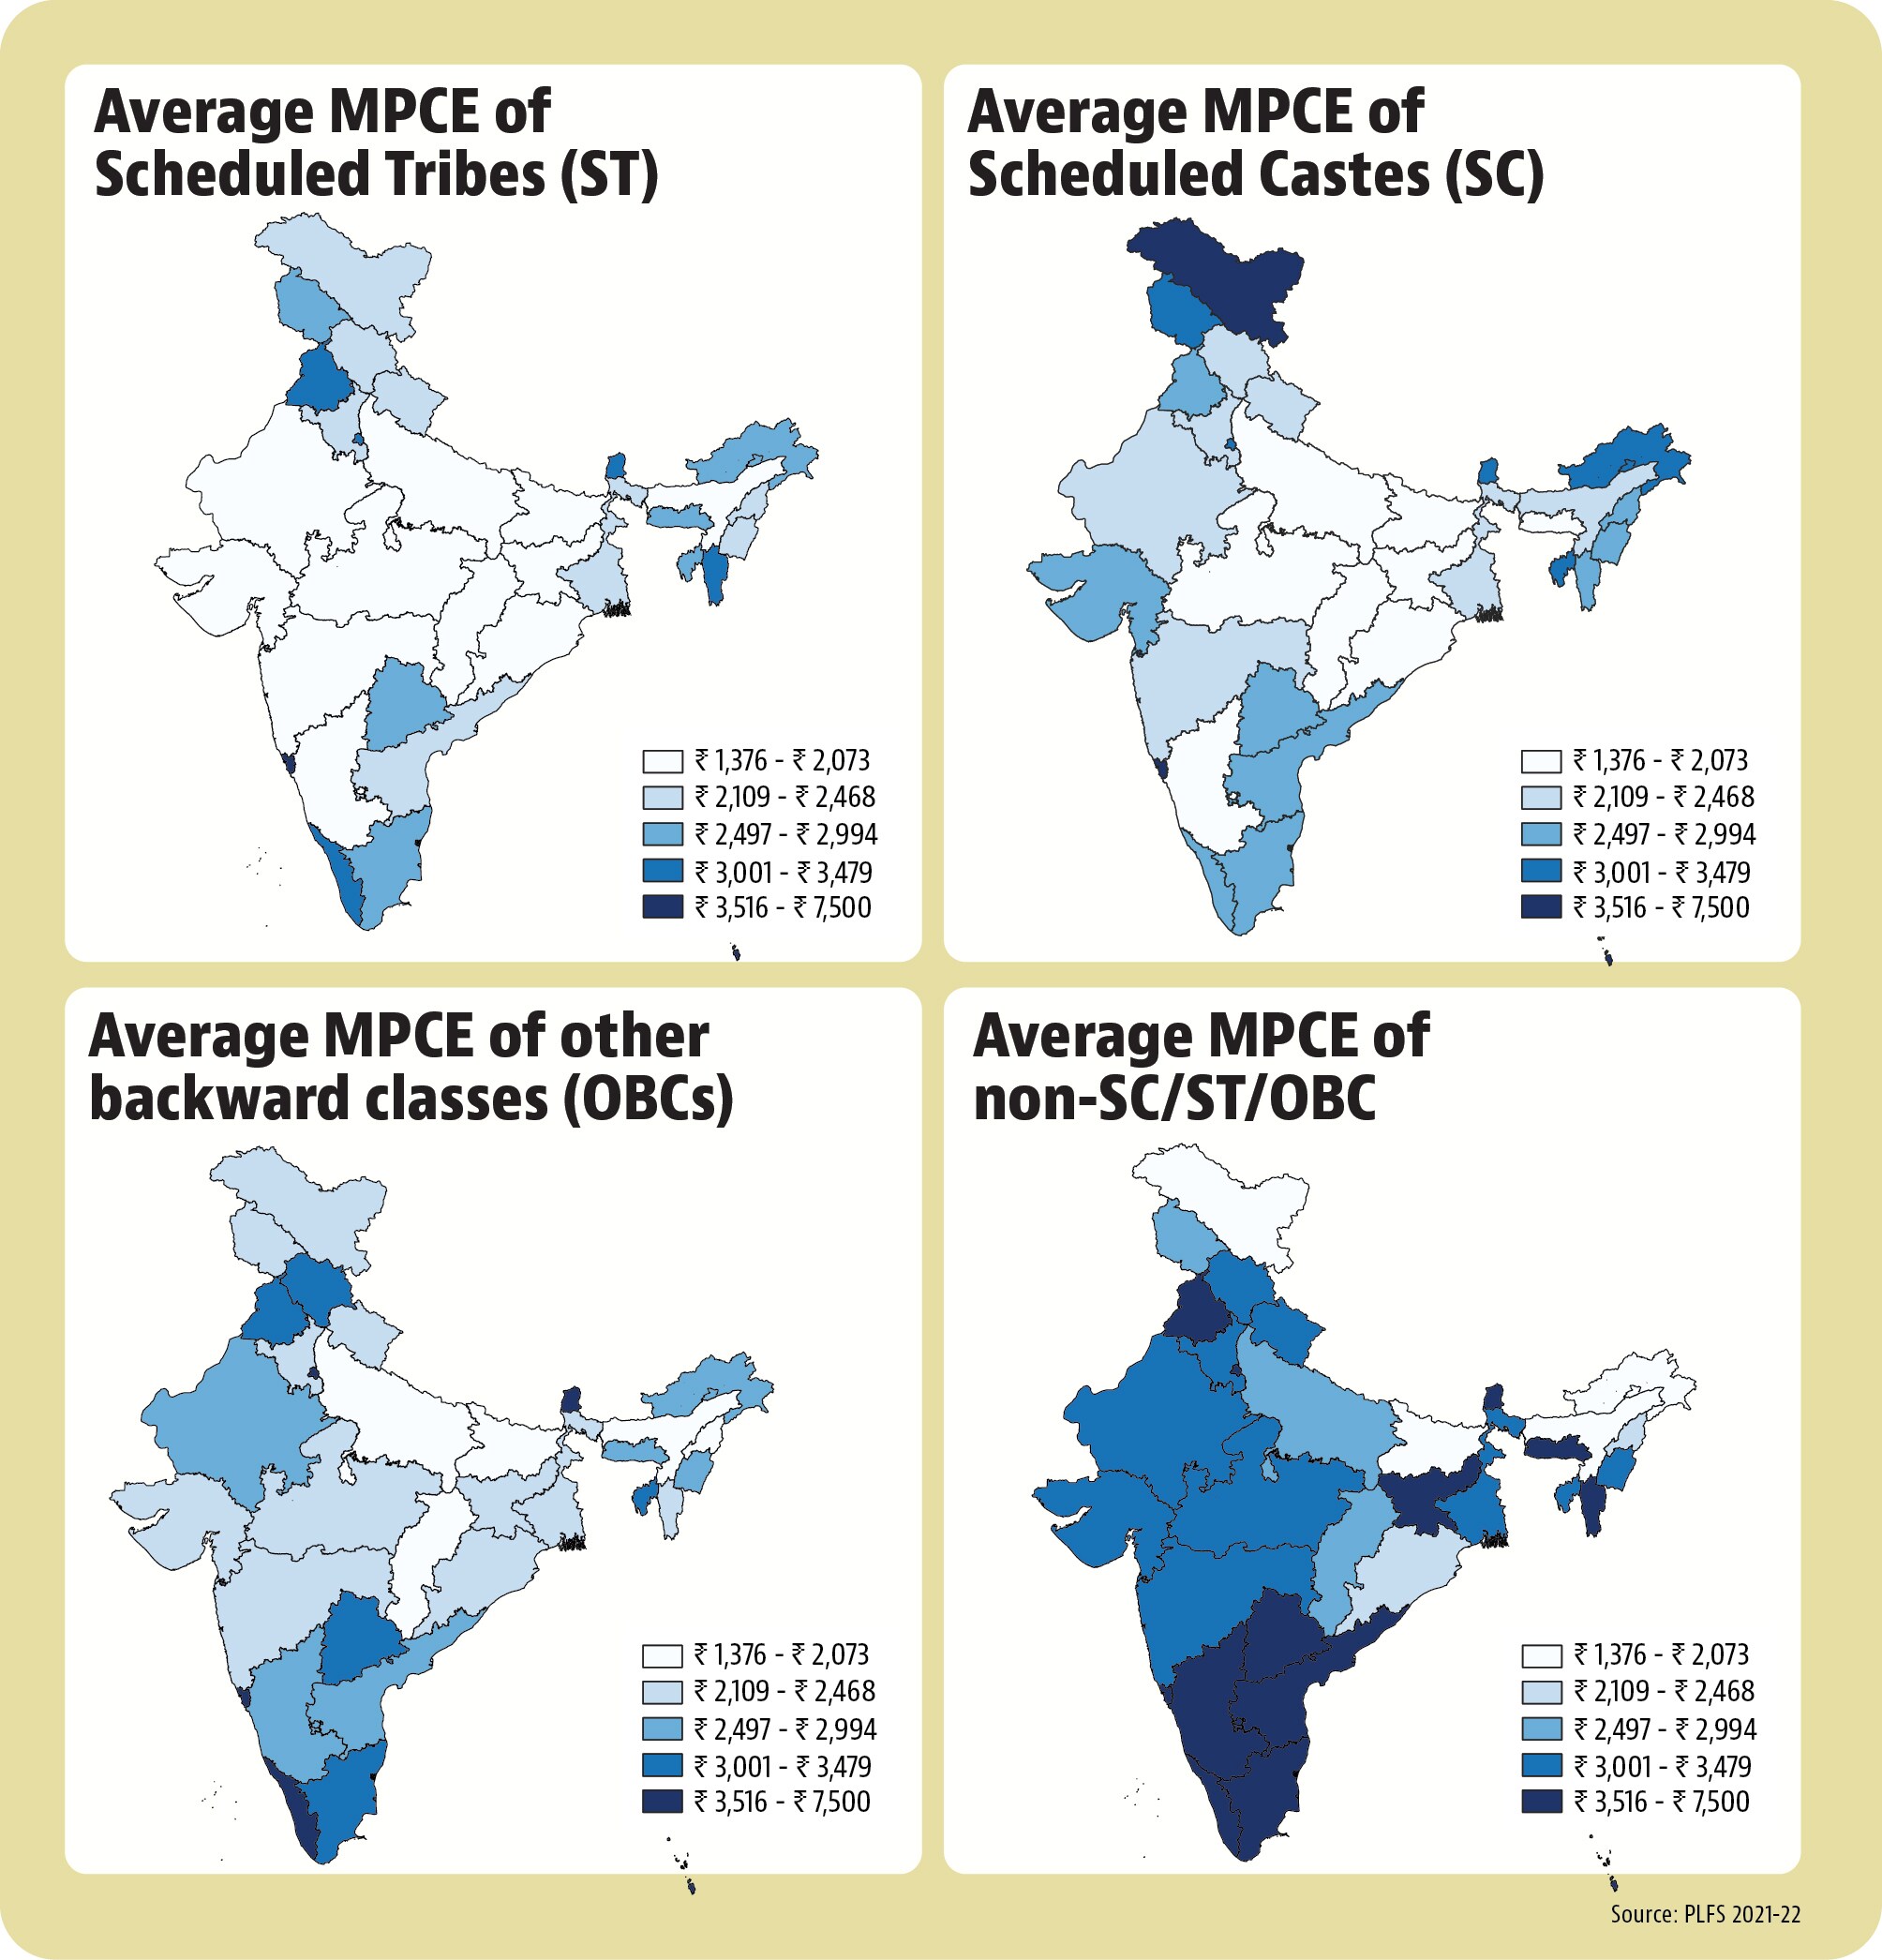
 Average upper caste households in Bihar are poorer than SC households in Tamil NaduThat Indian states vary drastically from each other in terms of economic performance is a well-known fact. This has a direct bearing on overall and per capita GSDP as well. What is often missed in this discussion is the point that gains or losses of a state being an economic leader or laggard accrue to all social groups in the state. This also means that the conventional understanding of economic hierarchy among SC-ST-OBC and others does not hold across states. An analysis of state-wise monthly per capita consumption expenditure (MPCE) – there is no official data on income in India – data across social groups clearly establishes this point. For example, the average MPCE for non SC-ST-OBC households in Uttar Pradesh and Bihar is lower than the average MPCE for SC households in Tamil Nadu. This underlines the fact that regional economic inequality is perhaps a bigger driver of economic inequality than caste in India. This is exactly why workers from north Indian states across social groups migrate to richer states in the south and west.
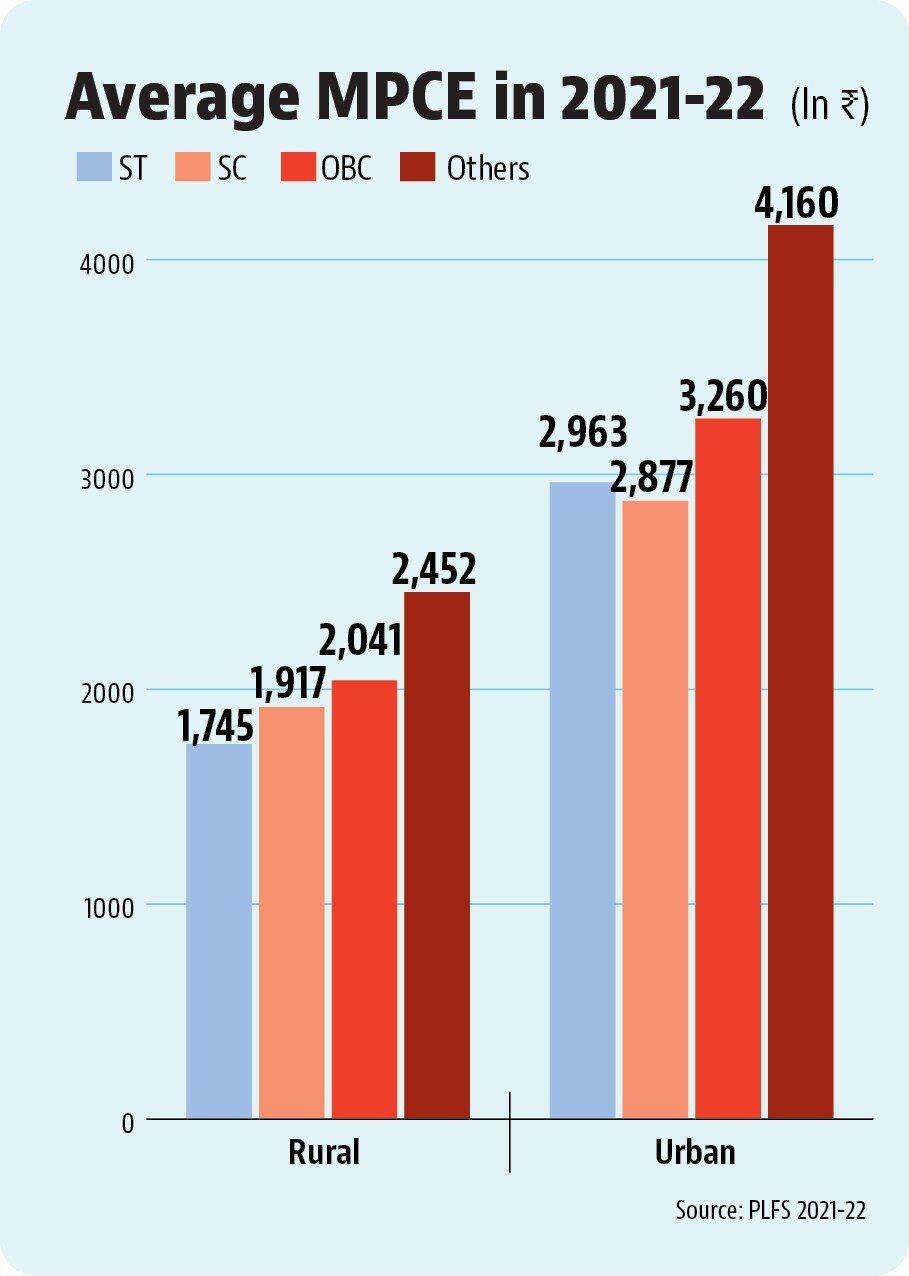
- The rural-urban factor in caste-based economic inequalityOnce again, numbers speak for themselves. Average MPCE for non SC-ST-OBC at the all-India level is ₹3,157, which is 1.68, 1.49, and 1.33 times the average MPCE for ST, SC and OBC households. A comparison of rural and urban MPCEs for these broad social groups shows that non SC-ST-OBC households have a bigger advantage over SC and OBC households in urban areas compared to rural areas. The extent of this urban advantage, once again, shows a large variation across states. To be sure, MPCE levels increase across social groups from rural to urban areas. The increase in incomes from rural to urban areas must be a big factor in demand for reservations as landing a government job is among the best ways to move to a city. However, it is also a fact that the majority of India’s population is still rural and lifting overall incomes in rural areas is a relatively bigger challenge than reducing caste-based inequalities.
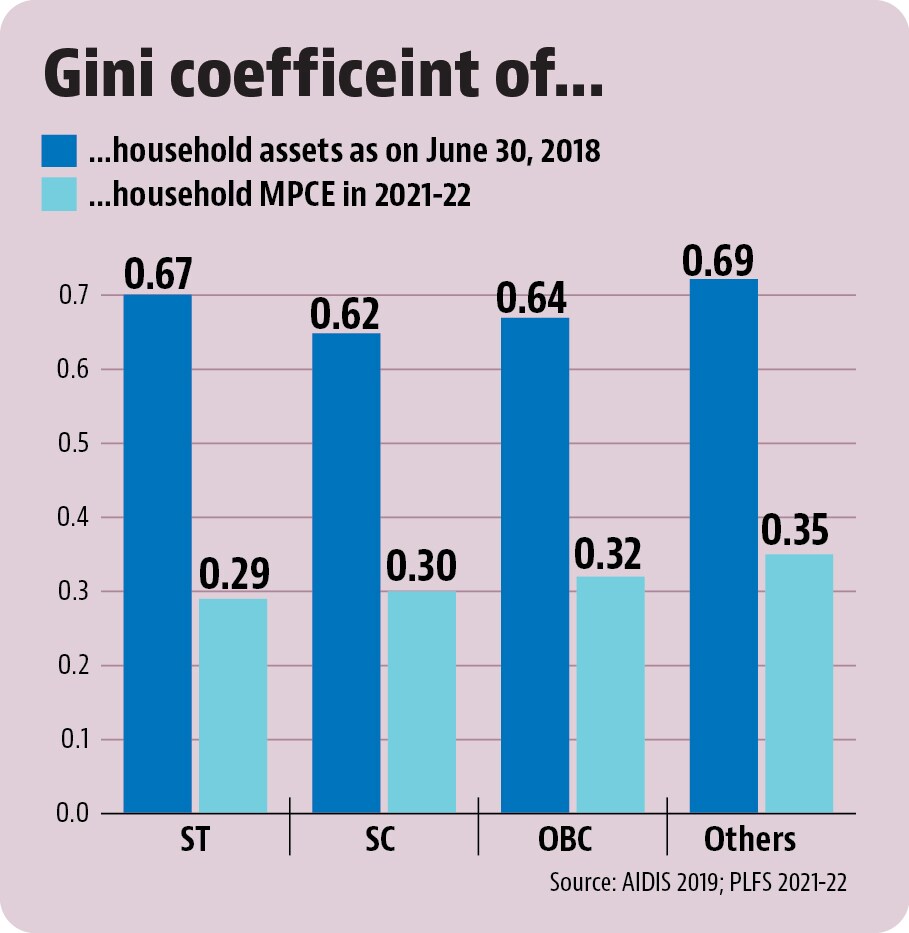
- Intra-group inequality within social groupsLack of sub-caste data makes it difficult to comment on economic inequality across sub-castes in a wider social group. However it is possible to get some idea into this inequality by comparing the mean and median of MPCE or asset for a given social group. Because mean MPCE/asset levels are obtained by dividing the total MPCE/asset value for a given social group by the population of that group, it can get skewed by extremes or either side. Median values, on the other hand, tell us about the MPCE/asset value for the middle of the distribution. A simple measure of intra-group inequality then can be the ratio between the mean and median MPCE/asset values. This shows that non SC-ST-OBC households have slightly higher intra-group inequality than SC, ST, or OBC households. A better way to measure intra-group inequality is to compare the Gini coefficients for these groups, which is 0 for perfect equality and 1 for perfect inequality. This number is also slightly higher for non SC-ST-OBC households than SC, ST, OBC households. This highlights that intra-group inequality is less in terms of MPCE of households than their assets. This is to be expected because assets reflect the inherited wealth of households over generations while monthly expenses are more likely to tell us about the current state of inequality in the labour market. To be sure, Gini coefficients do not tell us anything about absolute income or asset levels within a group.