
 E-Paper



Number Theory: Economic diversity and its role in Rajasthan polls
Campaigning for the Rajasthan elections scheduled for November 25 has ended

 Prefer HTon Google


Campaigning for the Rajasthan elections scheduled for November 25 has ended. In their manifestos released in the last week of the campaign, the two main parties in the contest – the Bharatiya Janata Party (BJP) and the Congress – catered to a wide range of economic groups. While promising something for a large share of voters such as welfare benefits is common in elections, some promises to different economic groups in Rajasthan are quite unique. For example, the Congress has promised interest-free loans to small traders. The BJP’s manifesto promises timebound completion of six special economic zones and speeding up the establishment of 13 industrial corridors. This appears strange for a state where agriculture’s share in GVA is third highest among India’s 21 biggest states by GDP or population. This is where Rajasthan’s economic diversity comes into play. Here are four charts which explain this in detail.

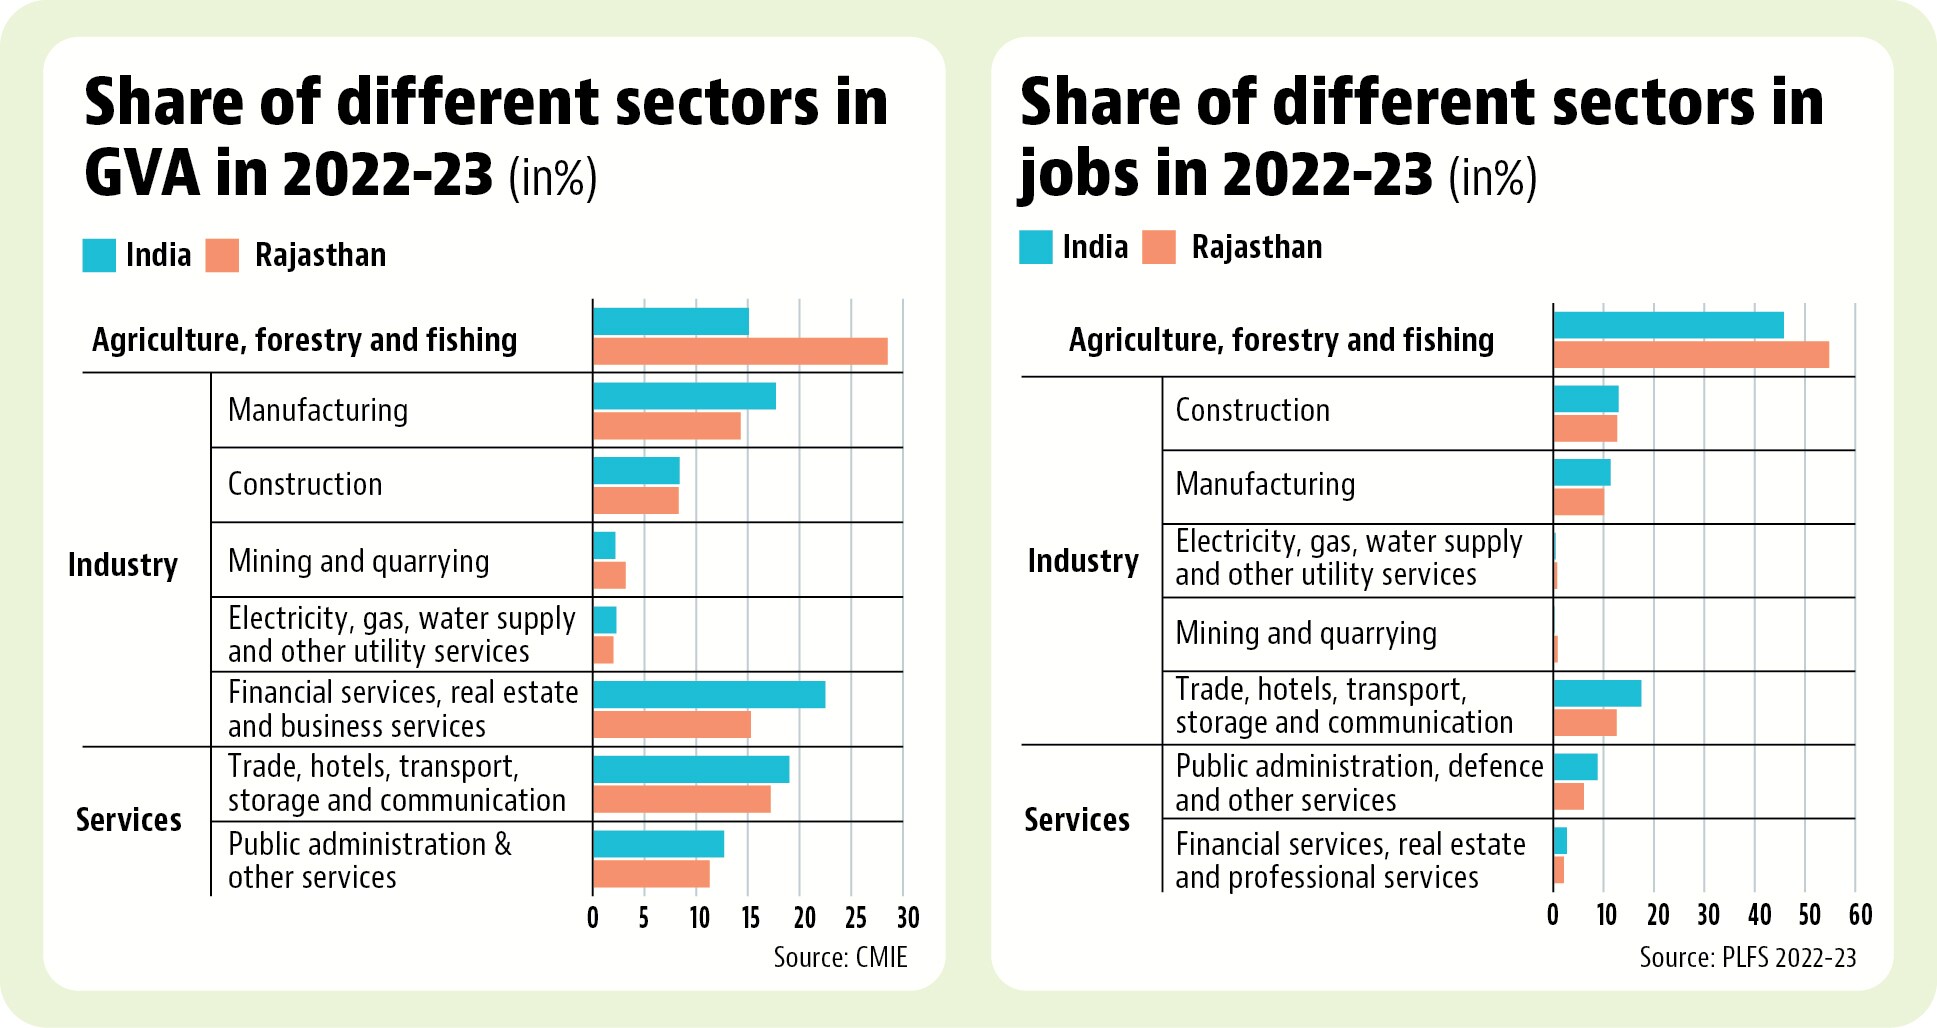
 GDP and employment share of agriculture, industry and services in Rajasthan and All-IndiaThe share of agriculture in both GDP and employment is significantly larger for Rajasthan than the all-India average. This would suggest that farmers are the only economic group which should matter in the state’s politics.
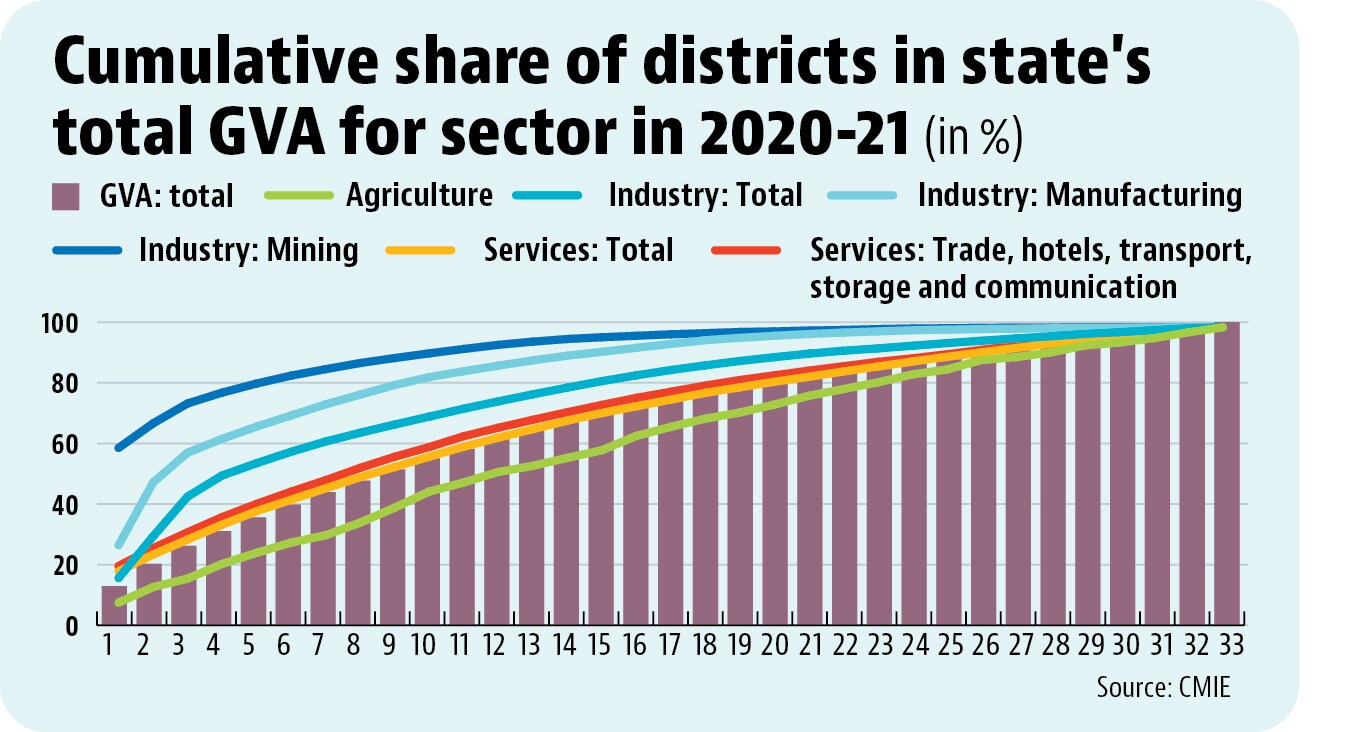
- District-wise cumulative share of agriculture, industry and services in RajasthanData from the Centre for Monitoring Indian Economy (CMIE) database shows this clearly. Nine out of the state’s 33 districts made up half the state’s GSDP in 2020-21, the latest year for which district-wise statistics are available in the CMIE database. In comparison, it takes 11 districts to make up half of the state’s agricultural GVA. This means that agricultural production is slightly more evenly distributed across the state. The reverse is true for sectors such as industry. Half of the state’s industrial output comes from just four districts, namely Barmer, Jaipur, Alwar, and Bhilwara. Sub-sectors of industry are even more concentrated. Just Alwar and Jaipur produce almost half the state’s manufacturing output and just Barmer produces almost 60% of the mining output.
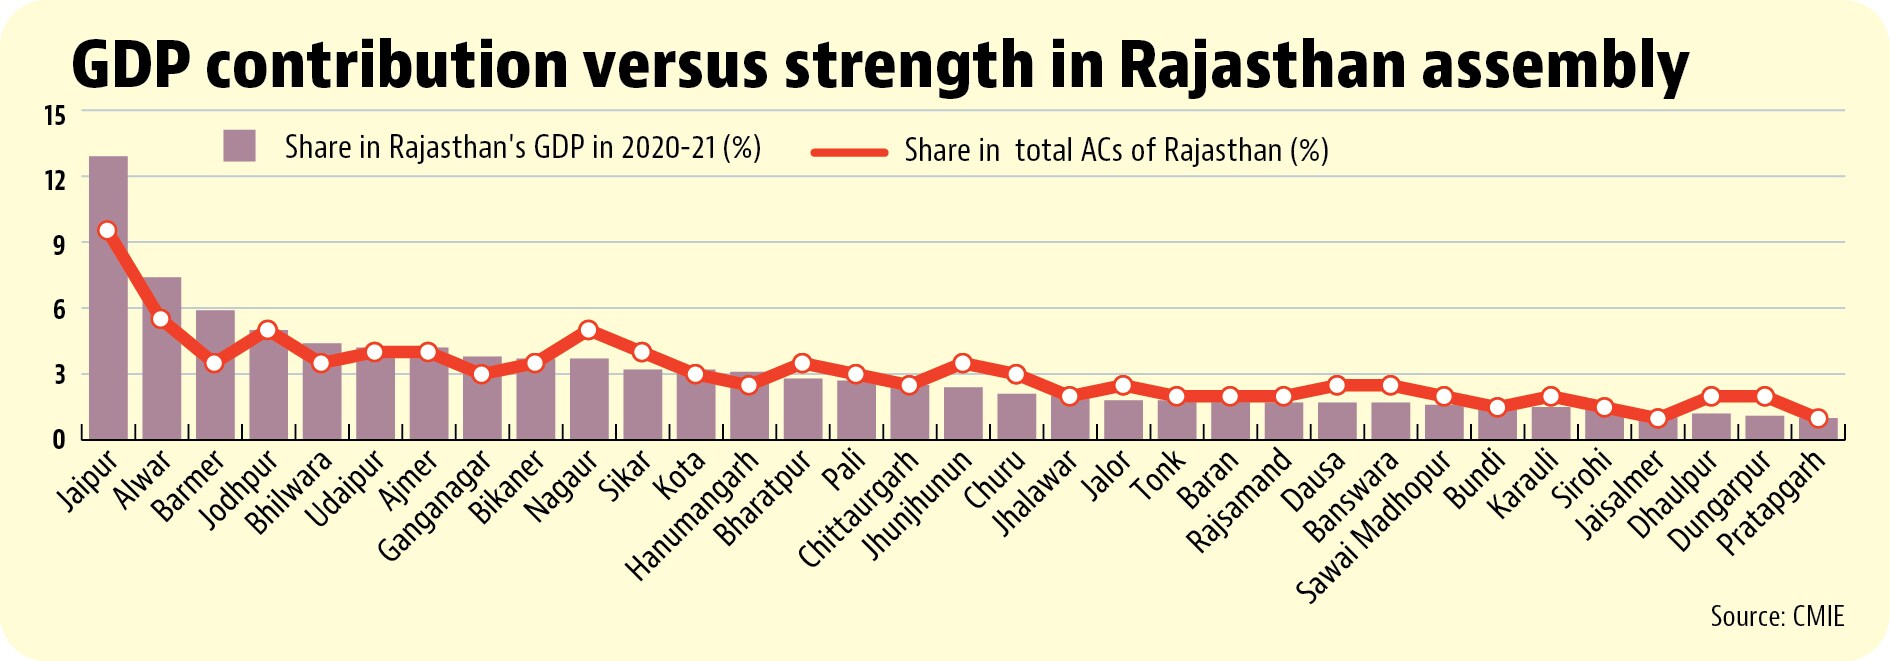
- (1/3rd of total) account for half of the state’s 200 ACsWhile the concentration of economic output in a few districts is not unique to Rajasthan, what makes the state somewhat unique is that the economic output of districts is positively correlated with their electoral importance. The nine districts with the highest contribution to the state’s GDP also have 42% of the 200 assembly constituencies (ACs) in the state. If one includes the next two districts by their GDP contribution, one can get to the halfway mark in the state assembly.
- Share of total population and richest quintile of Rajasthan living in districtData from the 2019-21 National Family and Health Survey (NFHS) shows this clearly. The top 11 districts with the highest GDP (that hold half the state’s assembly seats) account for 49% of the state’s population but are also home to 62% of the richest quintile (top 20%) of the state in terms of ownership of basic assets. This also suggests that voters in these regions are more likely to reward growth-oriented and not just welfare. This is exactly why Rajasthan’s politicians are trying to offer more than just welfare in these elections.




