E-Paper



The history of caste in the Bihar assembly - 1 | Number Theory
.

 Prefer HTon Google


On October 27, HT launched a complete caste database – it has been prepared by the first author of this story – of Bihar’s 3,629 MLAs from 1962 onwards in these pages. The methodology and possible limitations of this database were mentioned in that piece. The first story based on the database looked at the representation of Muslims in the Bihar assembly.
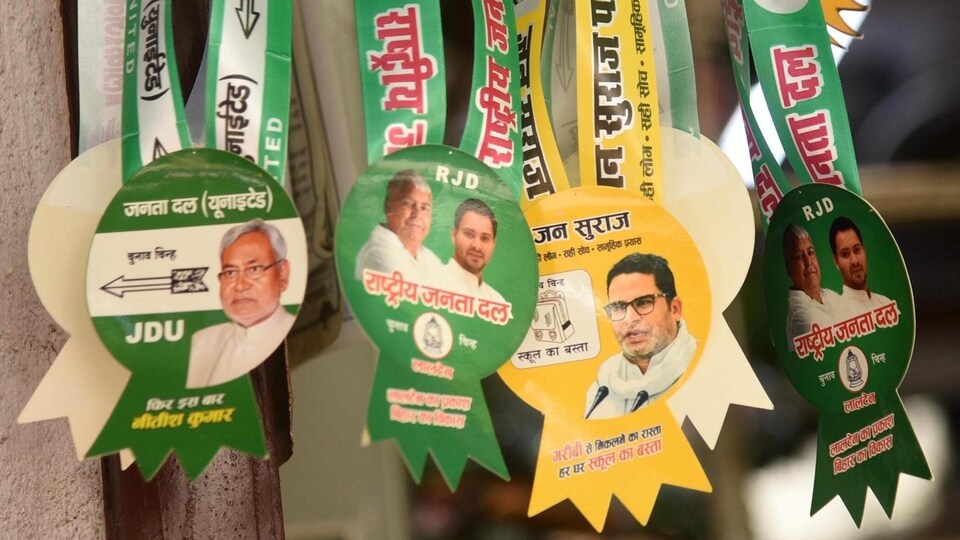
From today, we begin a three-part series looking at overall caste dynamics in Bihar assembly from 1962.
The first part of the story will provide summary stats on the overall social composition of all MLAs in the database and compare this with the social breakup of the population to ascertain its social representation or lack of it.
The second part of the series will look at the change in social profile of Bihar’s MLAs over time and whether there are discernible patterns which can be seen along with the change in the state’s overall politics.
The third part of the series will look at the party-wise nature of caste-representation in the Bihar assembly.
 Hindu backward classes have had the highest number of MLAs in BiharOf the 3,629 MLAs in our database, the highest number (1292 or 35.6%) are from Hindu subcastes which are broadly classified as Backward Classes (BCs) in Bihar. They are closely followed by the Hindu upper castes who do not belong to either Other Backward Class (OBC), Scheduled Caste (SC) or Scheduled Tribe (ST) categories. SCs are ranked third , which is a reflection of the legislative reservation for them. They are followed by Muslims and Extremely Backward Classes (EBC). For context, the broad OBC category is divided into BCs and EBCs in Bihar. A comparison with corresponding population share of each social group from the 2023 caste survey – to be sure, caste-wise population shares would have been different in the past than they are today – conducted by the Bihar government shows that Hindu upper castes have the highest representation, while Hindu EBCs have the lowest representation in Bihar assembly relative to their population, excluding STs, who have less than 2% share in the state’s population.
- At the sub-caste level, Yadavs lead the overall MLA countOut of 3,629 MLAs in our database, 734 are Yadavs, the highest for any subcaste. They are followed by Rajputs, Bhumihars, Muslims and Brahmins. To be sure, Muslims contain various subcastes within themselves, but this analysis has taken them as a homogeneous block. If one were to compare the composition of MLAs in Bihar at the subcaste level along with their population share from the 2023 caste survey, then the social inequality in political representation becomes much more acute than when analysed at the broad social-group level. Hindu upper castes, such as Bhumihars and Rajputs, have a significantly higher relative representation among Bihar MLAs and the overall advantage of Yadavs becomes moderate once adjusted for population. However, what is far more damning is that just 10 Hindu subcastes with a population share of 44.9% account for 80.5% of Bihar’s MLAs.
- The sub-region-wise caste dynamics in BiharBihar can broadly be divided into seven sub-regions: Bhagalpur-Munger, Bhojpur, Magadh, Mithila, Saran, Seemanchal and Tirhut. While the social composition of MLAs has been broadly similar across regions, except for a Muslim dominance in the Seemanchal sub-region there are some noticeable differences such as a higher share of upper castes and BCs in Saran and Magadh sub-regions. However, the real difference at the sub-region level can be seen in subcaste-wise-representation. For example, within upper castes, Brahmins have a much higher representation in the Mithila and Bhojpur sub-regions, while Rajputs have had a very high share of MLAs from the Saran sub-region. Among BCs, Kurmis are mostly confined to the Magadh sub-region while Yadavs have had a more than 20% share in MLAs from four sub-regions in the state.