
 E-Paper



Why monsoon surplus is limited despite floods | Number Theory
.
Updated on: Sep 2, 2025, 09:26:57 IST

 Prefer HTon Google
Share via


Copy link

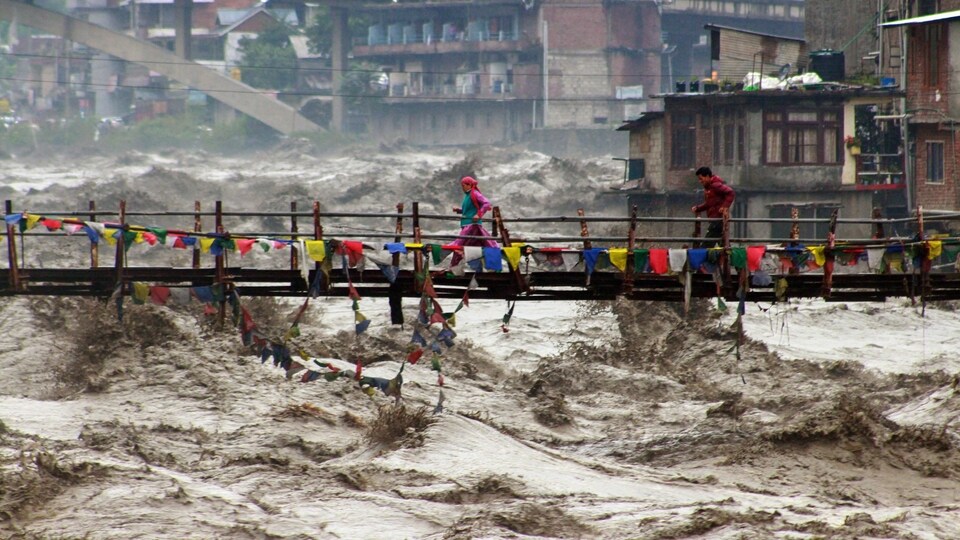
Northern India, particularly its north-western parts – such as Punjab, Himachal Pradesh, Uttarakhand, even the desert state of Rajasthan – has been reeling under floods and landslides this monsoon season. To be sure, even the plains have been flooded along the banks of the Ganga and Yamuna. Is it because this is a very wet monsoon? With 75% of the monsoon season over – it runs from June to September officially – the extent of unusual rain this monsoon is hard to capture in any single number. While disaggregated numbers solve this problem to some extent, one needs to drill down to very local numbers to see the disaster-causing potential of the 2025 monsoon. Here is why.
Why monsoon surplus is limited despite floods
- Headline number doesn’t show anything unusual in the seasonAccording to the gridded data (rainfall for every grid of around 25 km by 25 km ) of the India Meteorological Department (IMD), India has received 700.6mm rain this monsoon up to August. This is a middling amount of rain for the June-August part of the season, ranked 63rd highest in the 125 years since 1901, the first year for which this data is available. The rain up to August 31 this year is also just 1.2% more than the 1971-2020 average of this part of the season. IMD currently considers the 1971-2020 average as the Long Period Average (LPA) for tracking rain’s performance. To be sure, statistics generated from the gridded data are slightly different from the published statistics of IMD because of the different ways in which the data is averaged. However, the trend described is not much different.
 Disaggregating rain by time reveals periods of unusual rainThe average numbers for India for the season as a whole almost always hide wide variations in rainfall. For example, the season up to August 31 is not ranked very high largely because of July. June rain is ranked 35th highest since 1901 and August rain is ranked 44th highest since 1901. It is July rain – ranked 25th lowest since 1901 – that has dragged down the rank of the season overall. This can also be seen in daily trends in rain. There were 16 and 28 days of surplus rain in June and August, of which 11 days in each month had a surplus of at least 20%. On the other hand, only 12 days in July had a surplus, of which six days had a surplus of at least 20%.
- And the regularly flooded states are also captured by disaggregating rain data by regionThe states and UTs that have the biggest surplus in the season so far are Rajasthan, Himachal Pradesh, Uttarakhand, Jammu and Kashmir, and Punjab. They have a surplus in the 29% (Punjab) to 56% (Rajasthan) range. Similarly, while rain in the country is not ranked very high, this is the fourth wettest monsoon for Rajasthan, ninth for Himachal Pradesh, 13th for Uttarakhand, 15th for Punjab, and 24th for Jammu and Kashmir. This is not surprising. These regions have reported widespread floods or regular floods and landslides. However, numbers aggregated to state level fail to explain why the floodplains of the Ganga in Bihar and Uttar Pradesh are also flooded. The two states have deficits of 26.6% and 6.5%, respectively.
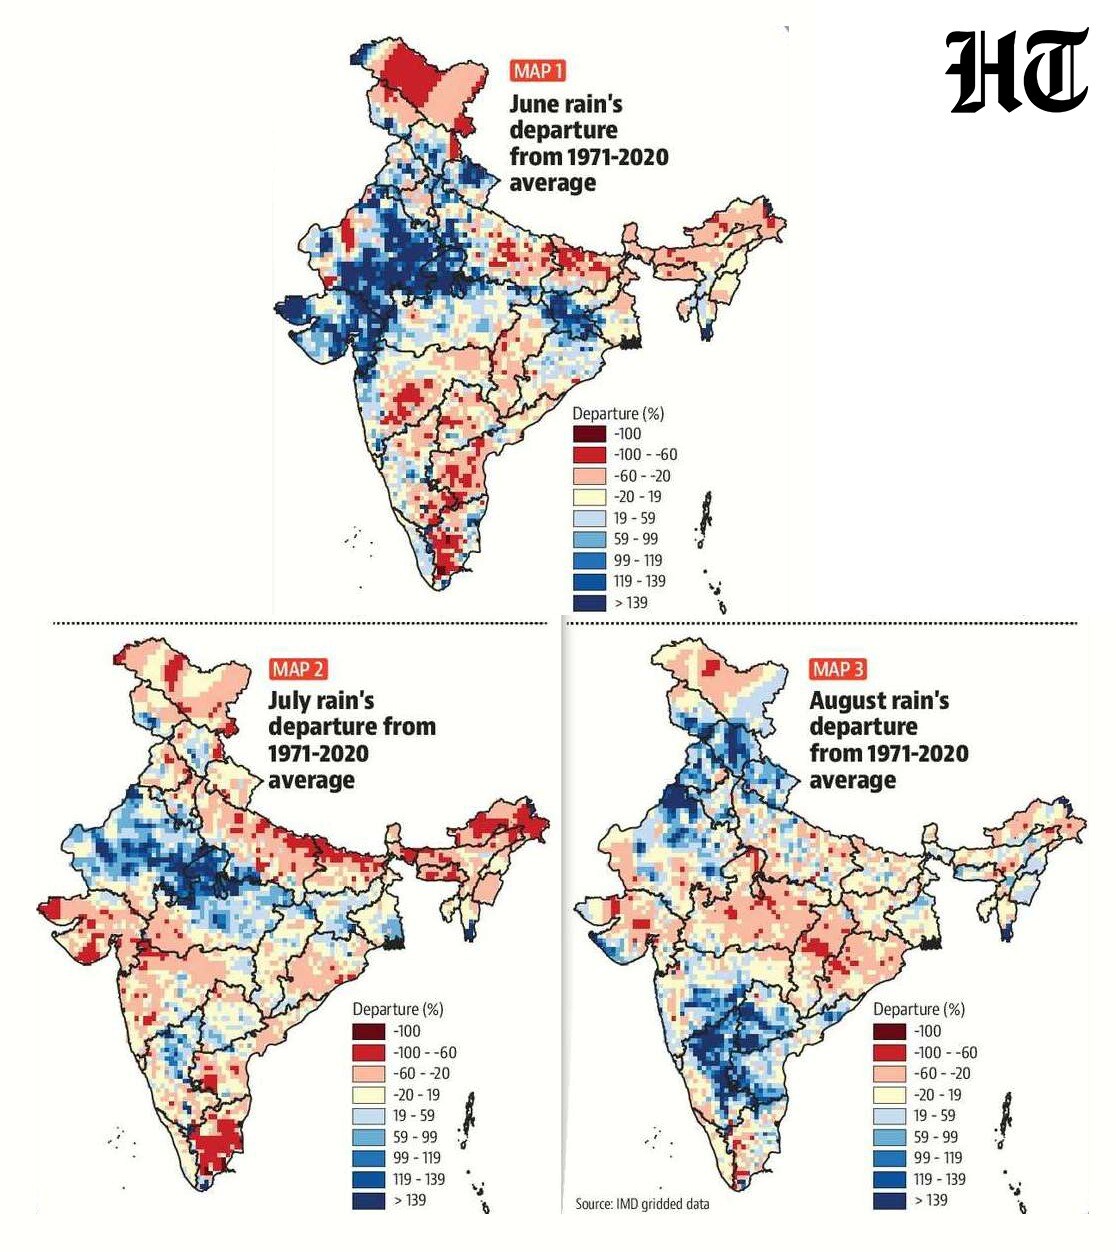
- Local numbers show why average statistics don’t capture rain’s flood-causing potentialThe reason why the numbers above don’t capture the flood-causing nature of rain this year is that the nature of skewness is different for different places. As the accompanying maps show, only places such as Rajasthan follow an expected trend. Large parts of the state have had a big surplus every month. Other states/UTs have received a very big surplus either in only parts of the region or only parts of the season. Jammu and Kashmir, Himachal Pradesh, Uttarakhand, and Punjab are all examples of this. Parts of these regions have received more than double the LPA rain in August and June although they remained largely dry in July. The rain will appear even more skewed if the numbers are further broken down. As HT reported earlier, the four northern states/UTs received almost double the rain of their wettest week on the LPA chart last week. Similarly, large parts of Bihar and Uttar Pradesh have remained dry for most of the season. However, the path of the Ganga had a surplus in August, which explains the river overflowing at most places.




Unlock a world of Benefits with HT! From insightful newsletters to real-time news alerts and a personalized news feed – it's all here, just a click away! -Login Now!


