E-Paper



Number Theory: Economic fallout of the disruptions at Red Sea
According to official estimates released along with a joint statement by governments of 14 countries, as much as 15% of global seaborne trade passes through it

 Prefer HTon Google


The Red Sea, which lies toward the south of the Suez Canal, is one of the busiest shipping routes in the world as it connects Europe to Asia. According to official estimates released along with a joint statement by governments of 14 countries including the US, the UK, Bahrain, Canada and Germany, as much as 15 percent of global seaborne trade passes through it. However, hundreds of ships have avoided this crucial trade route since November, fearing attacks from Iran-backed Houthi militants based in Yemen.
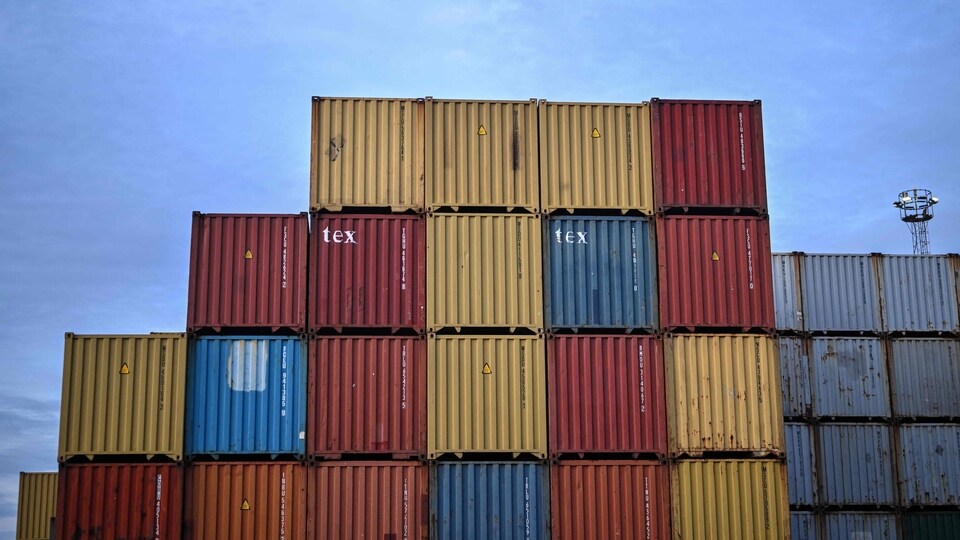
For months now, the Houthis have been attacking ships entering the region that they say are either linked to Israel or heading to Israeli ports, in an attempt to force it to end its military campaign in the Gaza Strip. These attacks have persisted despite airstrikes by the US and its allies in Yemen in retaliation.
The charts below show how disruptions in the Red Sea have impacted global trade, forcing ships to choose longer routes with increased financial as well as environmental costs.
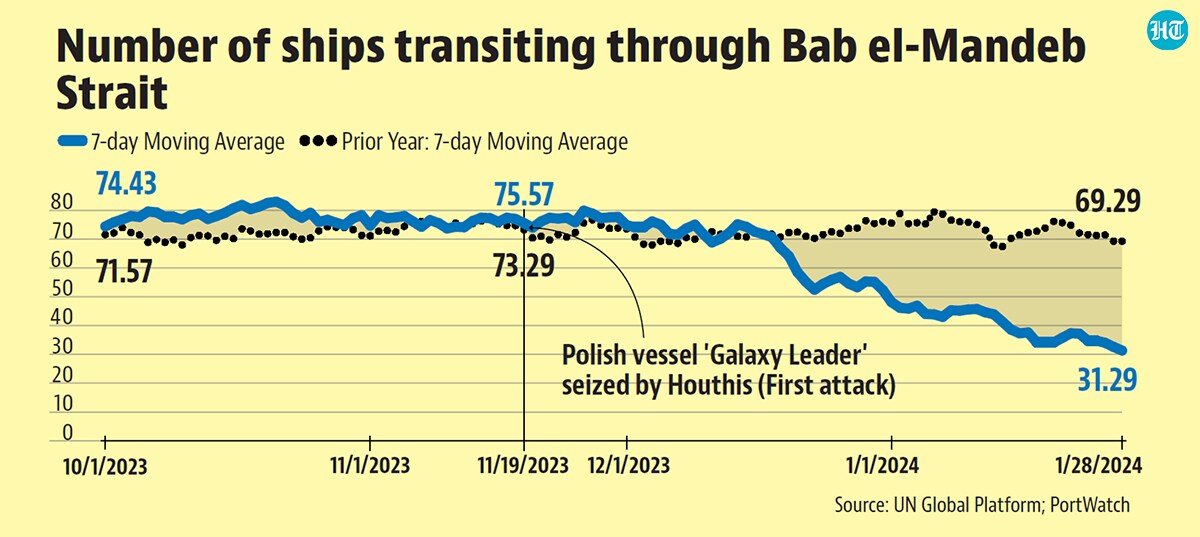
 Fall in ships crossing the Red SeaHouthis began their attacks on ships passing through the Red Sea on November 19 by hijacking the Galaxy Leader, a car carrier linked to Israeli businessman Abraham Ungar. The attacks further intensified in December and are still ongoing. Although Houthis claim that they only attack Israel-linked ships, vessels from around 12 countries have been attacked so far, and many of them were not travelling to and from Israel. The result has been a notable decline in ships passing through the Red Sea. On November 18, as many as 84 ships passed through the Bab el-Mandeb Strait, which connects the Red Sea with the Gulf of Aden and the Indian Ocean. By January 28, this figure went down to 28. The gap between the present 7-day moving average of ships that made transit calls at the strait and that of the last year have also been widening since the attacks began.
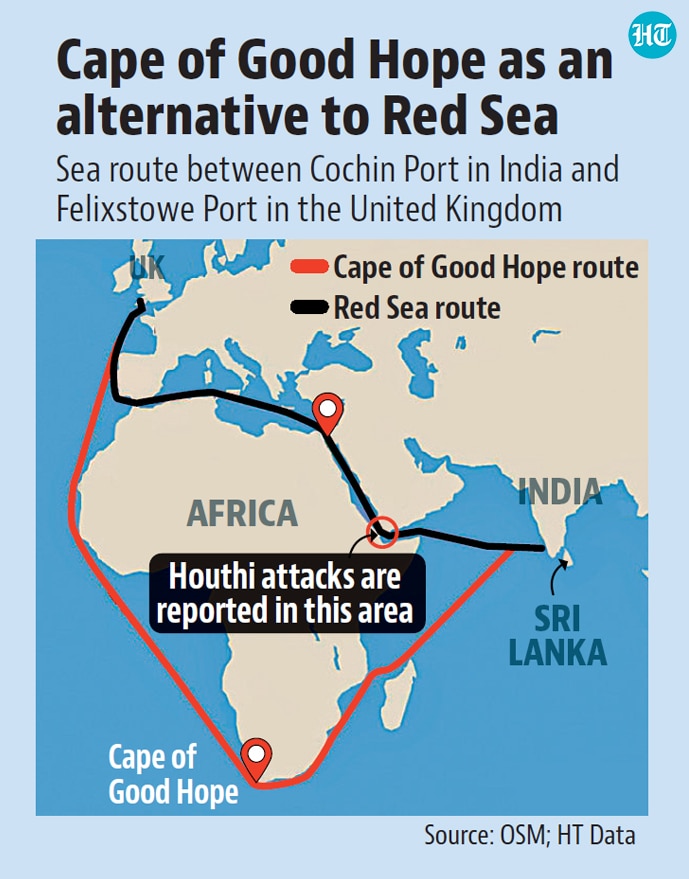
- Alternative routesAs disruptions in the Red Sea continue, shipping companies have been forced to reroute their vessels through the longer route via Cape of Good Hope in the Southern Africa. This considerably increases the financial cost and time taken for each trip. “Having monitored developments closely and retrieved all available intelligence, Maersk has decided that all vessels previously paused and due to sail through the region will now be re-routed around Africa via the Cape of Good Hope for safety reasons,” said Maersk in a statement released in December. “Diverting vessels around the Cape of Good Hope to mitigate the ongoing risks of sailing through the region is a necessary step in the interest of safety, but it has ultimately brought about increased costs for carriers,” the Danish shipping giant remarked.
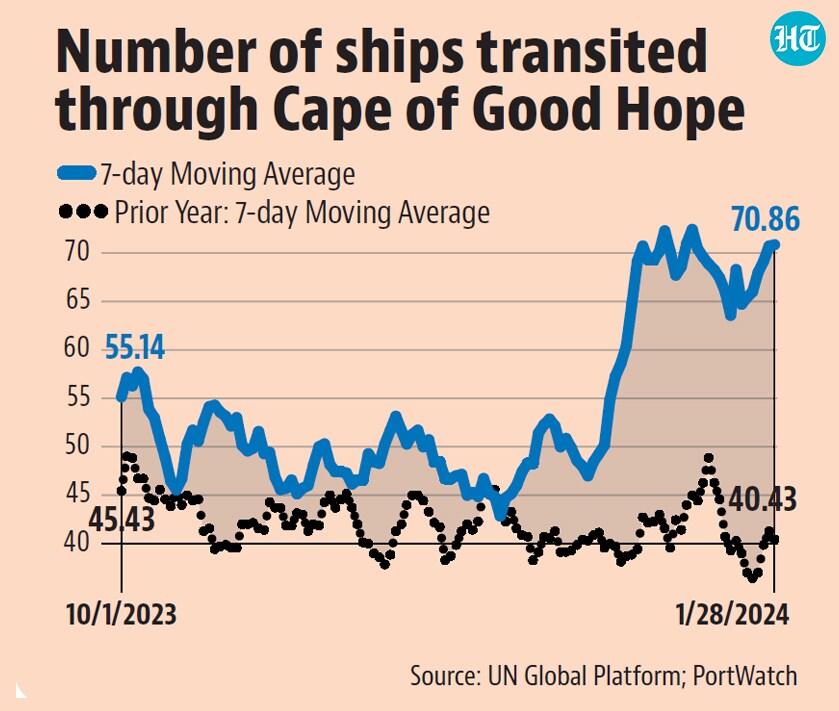
- Pinning hopes on Cape of Good HopeWith ships being rerouted away from the Red Sea, the number of them transiting via Cape of Good Hope has been on a steady rise since the second week of December 2023. Only 52 vessels had passed through the strait on November 19, the day of the first attack. By January 28, this figure has gone up to reach 85. There has been more than a 64% increase in the number of ships that transited through Cape of Good Hope in the first 10 days of January 2024, compared to the same period in the previous year. Shipments between Indian and Europe have also faced disruptions. “Indian fertilizer cargoes are now coming via the Cape of Good Hope that has raised freight costs significantly,” said Union minister for health, fertilisers and chemicals Mansukh Mandaviya in January. He added that since the country has enough reserves, the disruptions won’t cause any shortage in fertilisers. Arun Kumar Garodia, chairman, Engineering Export Promotion Council of India (EEPC), told Reuters last month that Indian exports worth at least $10 billion would be hit in the fiscal year to March 2024 due to the rising shipping costs and delay in delivery of orders.
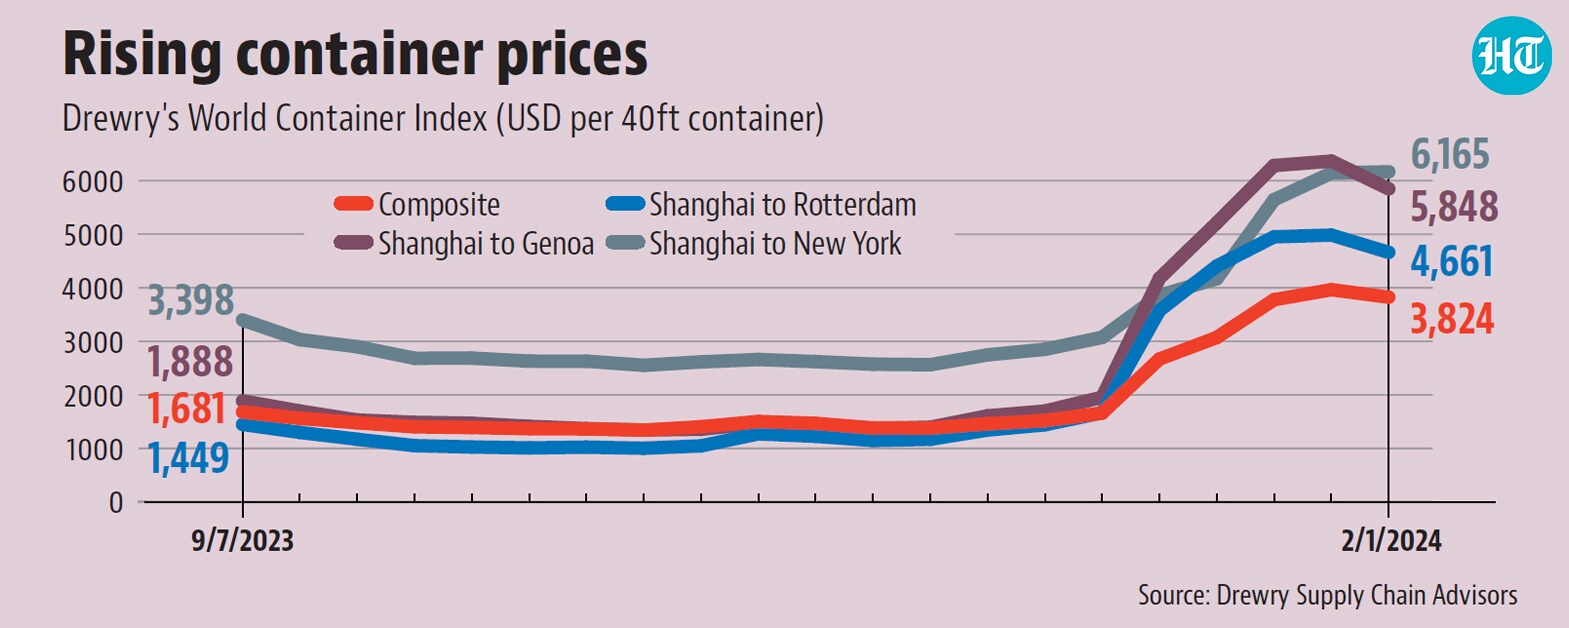
- Surging container pricesWith container ships having to take lengthy detours, the spot rates for containers have skyrocketed in global markets. The Drewry World Container Index, which reports actual spot container freight rates for major East West trade routes, have gone up to reach $3,824 per 40ft container as of February 1, which is 88% higher than the rates recorded during the same period last year. This is also the highest the composite index has recorded since October 2022 and is 169% more than average 2019 (pre-pandemic) rates of $1,420. All the East to West trade routes tracked by the index have seen an overall increase in their container prices. However, freight costs aren’t the only thing that has gone up. “Alongside higher freight costs, there has been an increase in insurance charges, especially for US, UK and Israeli vessels,” said a report by Nomura citing industry sources released in January.
- Not just about financial costsAs the route via Cape of Good Hope is lengthier, ships will also have to spend more time and fuel to reach their destination. For example, the distance between the Cochin Port in India and Felixstowe Port in the United Kingdom, which is the country busiest port, is 12,231 kilometres via the Red Sea. However, avoiding the Red Sea mean that ships will now have to travel an extra 7,258 kilometre via the Cape of Good Hope, according to data from maritime information company Searoutes. The data also show that a tanker vessel running on diesel, carrying 10 20-feet containers and travelling at 20 knots (38.89 km/hr) could earlier complete the journey through Red Sea in 13 day and 8 hours. However, with the detour, the same vessel will take 20 days and 21 hours to complete the journey. Such a journey would have earlier resulted in 9.76 tonnes of C02 equivalent (tCO2e) emission, this too will go up considerably to reach 15.55 tCO2e. Meanwhile, according to Danish consultancy firm Sea-Intelligence, CO2 emissions per twenty-foot equivalent unit (teu) could rise from anywhere between 31 to 575% for the rerouted ships. If the crisis continues, it could also worsen inflation, with JPMorgan Chase estimating that price for consumer goods could go up 0.7% in the first half of 2024.