E-Paper



Number Theory: A portrait of India's 18 million 1st-time voters
This is the 2nd of a two-part data journalism series about characteristics of India’s voters. The 1st looked at difference between 2024 voters & other LS polls.
Published on: Apr 18, 2024, 08:31:12 IST


Share via


Copy link

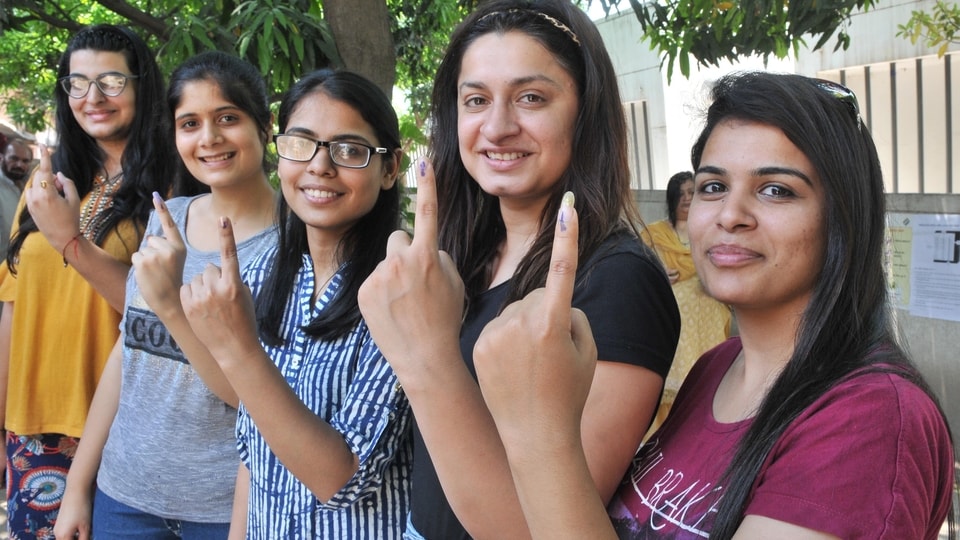
18.2 million voters will exercise their franchise for the first time in the 2024 general elections according to the Election Commission of India (ECI). What do these voters do? How do they compare with their peers in the 2019 elections?
While ECI does not give any data to answer these questions, we can arrive at some estimates using the Periodic Labour Force Survey (PLFS) conducted by the National Sample Survey Office (NSSO). PLFS is an annual survey which takes into account both employment status and household characteristics of persons in India. Here is what the data shows.
A portrait of India's 18 million 1st-time voters
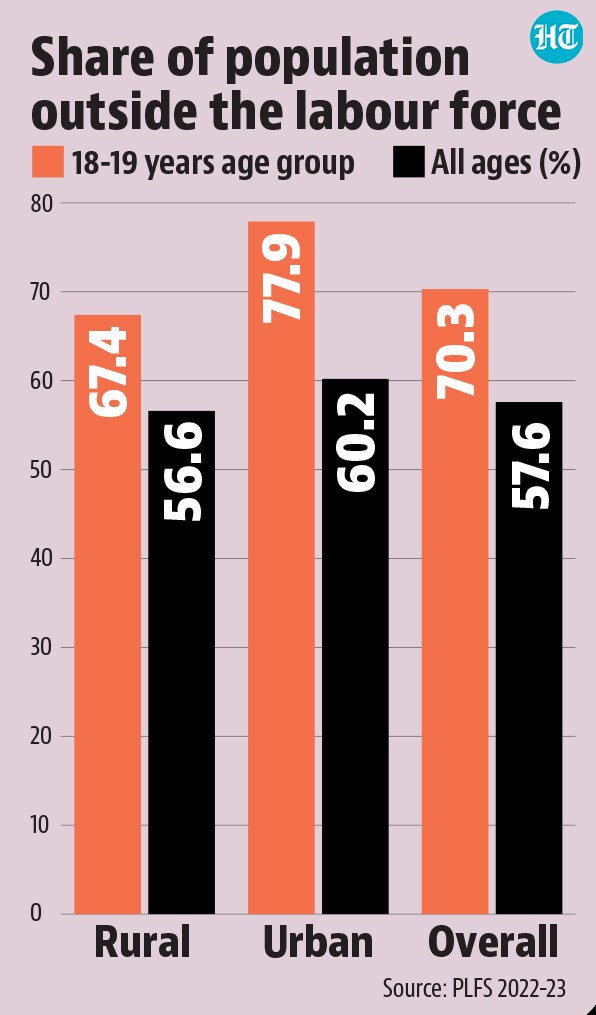
 70% of first-time voters are yet to enter the labour forceThe latest PLFS data we have is for the July 2022 to June 2023 period. This means that the 17-18-years-old cohort would be the first-time voter cohort in the 18-19-years-old age-group for 2024 elections. While PLFS allows us to track 17-18-year-olds as well, HT decided to track 18-19-year-olds in the 2022-23 survey to describe the characteristics of first-time voters. This is because of three reasons: one, the condition of 18-19-years age group in 2024 is unlikely to be very different from what it was for this cohort in 2022-23; two, the survey is likely to have excluded those under the age of 18 years from data it captured on account of several activities (such as driving or some scheduled hazardous occupations); three, the 17-18 year-olds covered in the survey would have likely been in school. PLFS data supports this line of reasoning. Labour force participation rate (LFPR) – the share of population either working or looking for a job – increases sharply from 18.6% at age 17 to 28.5% at age 18, but only to 31.3% at age 19. LFPR for first-time voters was 29.7% in the survey, which means that 70% of first-time voters are outside the labour force. This number is just 58% for the overall population and 42% for the 15 years and above age group. To be sure, there is a difference in labour force participation by location. 67% of the age group in rural areas is outside the labour force compared to 78% in urban areas.
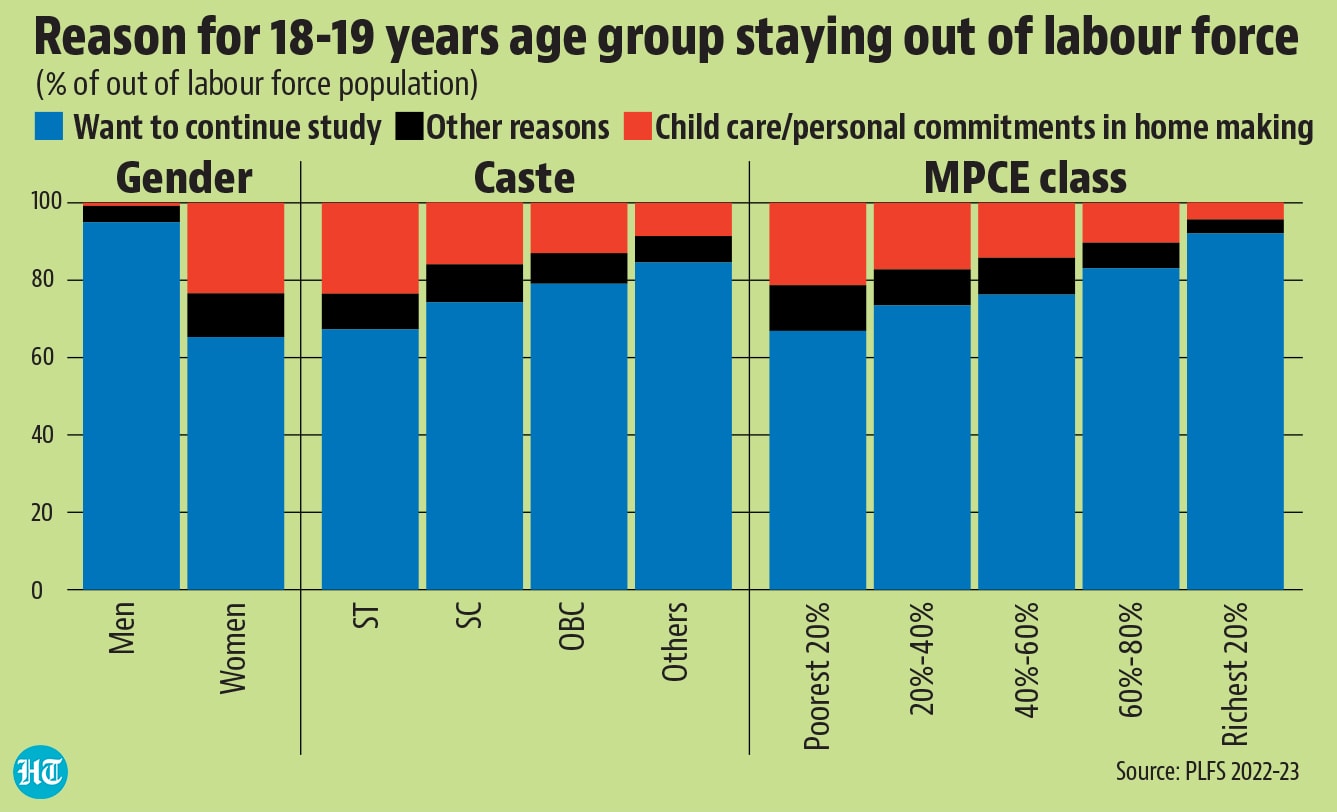
- Not every first-time voter outside the labour market is likely to be studyingA majority of first-time voters who are not in the labour force are studying. But there is a big gender gap here. While 95% of the men reported education as the reason for staying out the labour force, this number was just 65% for women. To be sure, gender is not the only factor which matters here. Class and caste – they are closely interconnected in India at least at the group level – also play a role. Education was the reason for being out of the labour force for 67% of the age group among the scheduled tribes (STs) and the poorest 20%. This number was 92% for the richest 20%; and 85% for those not part of STs, scheduled castes (SCs), and other backward classes (OBCs).
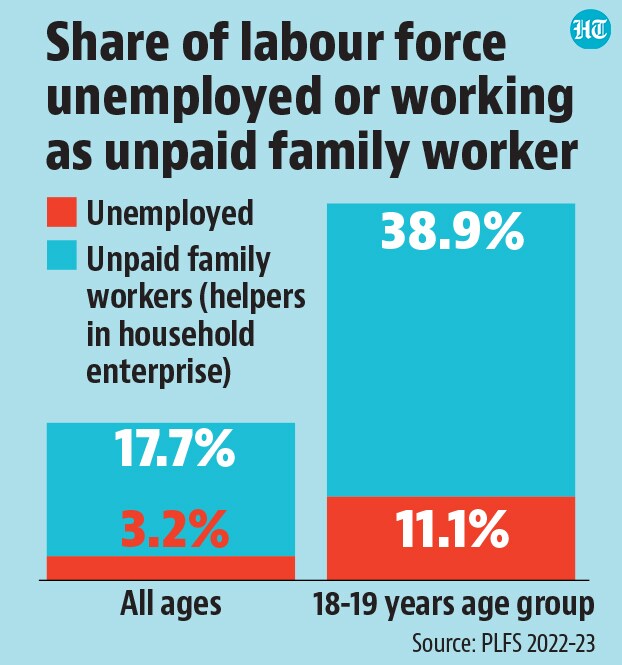
- Unemployment and unpaid work are a much bigger problem for first time voters than the overall labour forceAmong first-time voters who are part of the labour force, unemployment and unpaid work is a much bigger problem than for the labour force taken as a whole. The unemployment rate for first-time voters was 11.1% in 2022-23 compared to the overall unemployment rate of 3.2%. Unpaid family workers (they are recorded as part of self-employed workers in PLFS) and unemployed taken together made of up half of the age group’s labour force compared to 21% of the overall labour force. While some of this can be explained by such workers being in their apprentice phase, it does suggest that first-time voters who are having to work would likely not be satisfied with their economic condition.
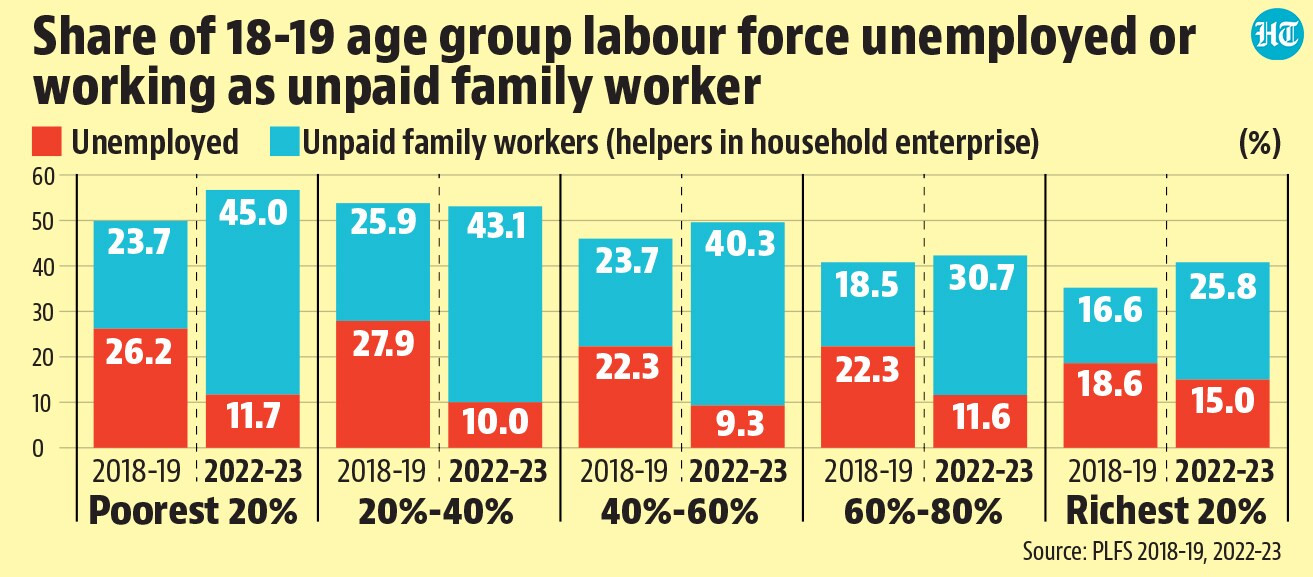
- How have labour market conditions changed for first time voters since 2019?This is an important question because today’s young workers are likely to compare their well-being or lack of it with their peers who entered the labour force earlier. A comparison of 2022-23 PLFS results with 2018-19 numbers shows that unemployment rate has fallen for all workers and also for the category we have defined as first-time voters. However, most of this improvement is on account of rise in unpaid work. Is there a class-aspect to this question? A monthly per capita expenditure (MPCE) wise comparison of 2018-19 and 2022-23 numbers shows that the combined proportion of unemployed and unpaid workers in the labour force has increased the most for those in the richest and poorest 20%, but it has remained relatively stagnant for those in the middle. To be sure, the headline unemployment rate has decreased the least for the richest 20%; and was 15% in 2022-23 compared to 18.6% in 2018-19. For each quintile class below the top 20%, the unemployment rate was between 9.3% and 11.7% , half or less of its 2018-19 level.