
 E-Paper



3 major takeaways from nutritional intake data | Number Theory
.
Updated on: Jul 3, 2025, 08:40:12 IST

 Prefer HTon Google
Share via


Copy link

The National Sample Survey Office (NSSO) released its report on nutritional intake in India after more than a decade earlier this week. The latest report gives data for 2022-23 and 2023-24. To be sure, the nutritional intake surveys are essentially extrapolated numbers using quantities of food items consumed as seen in Household Consumption Expenditure Surveys (HCES). HT has already reported that the latest report largely shows an improvement in nutritional intake between 2011-12 and 2023-24. This key takeaway notwithstanding, there are some other interesting trends in the report. Here are three charts that summarise them.
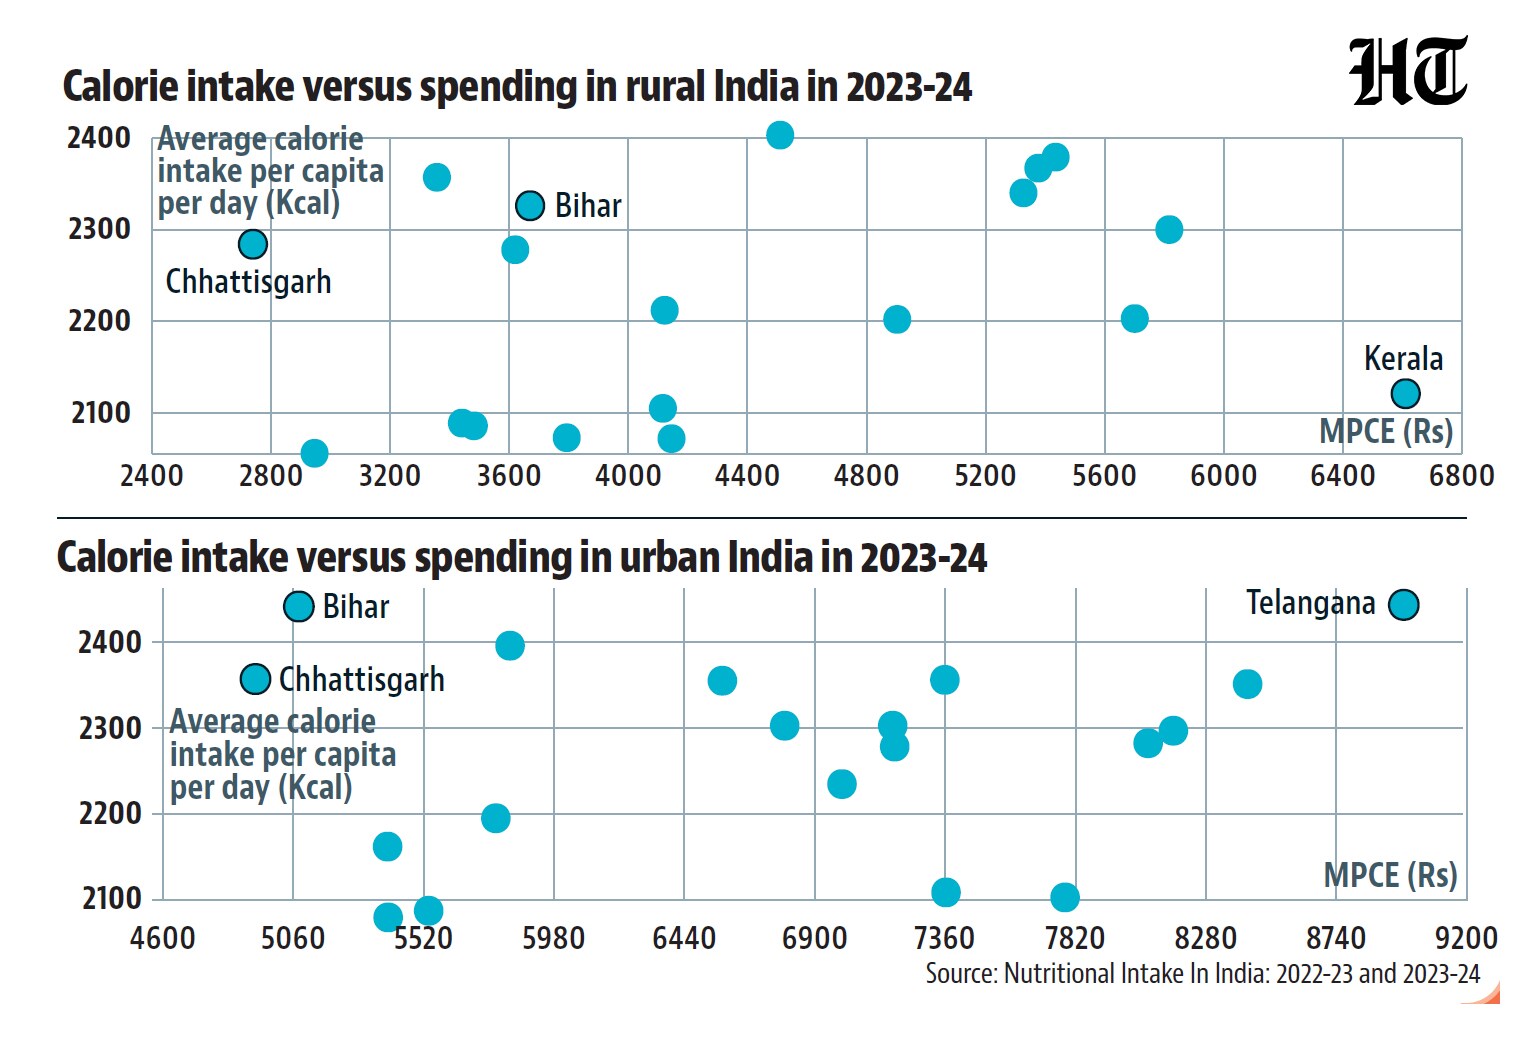
 Richer people have higher nutritional intake but richer states not so muchOne of the most important (and intuitive) trends in the nutritional intake data is that people’s nutritional intake rises with their overall spending levels (a proxy for income). The top 5% of the population consumes at least 1.7 times more calorie, protein and fat than the poorest 5%. One would believe that a similar relationship should hold between rich and poor states as well. However, data shows that this is not the case; and the correlation between average spending level and calorie intake across states is significantly weaker than one between calorie intake and overall spending levels in general. For example, Bihar, the second poorest of 18 major states by the MPCE (monthly per capita consumption expenditure) of urban India, consumes the second highest calories per capita. To be sure, it is possible that MPCE classes are correlated with calorie consumption intrastate. However, this data is not available in the report released June 30.
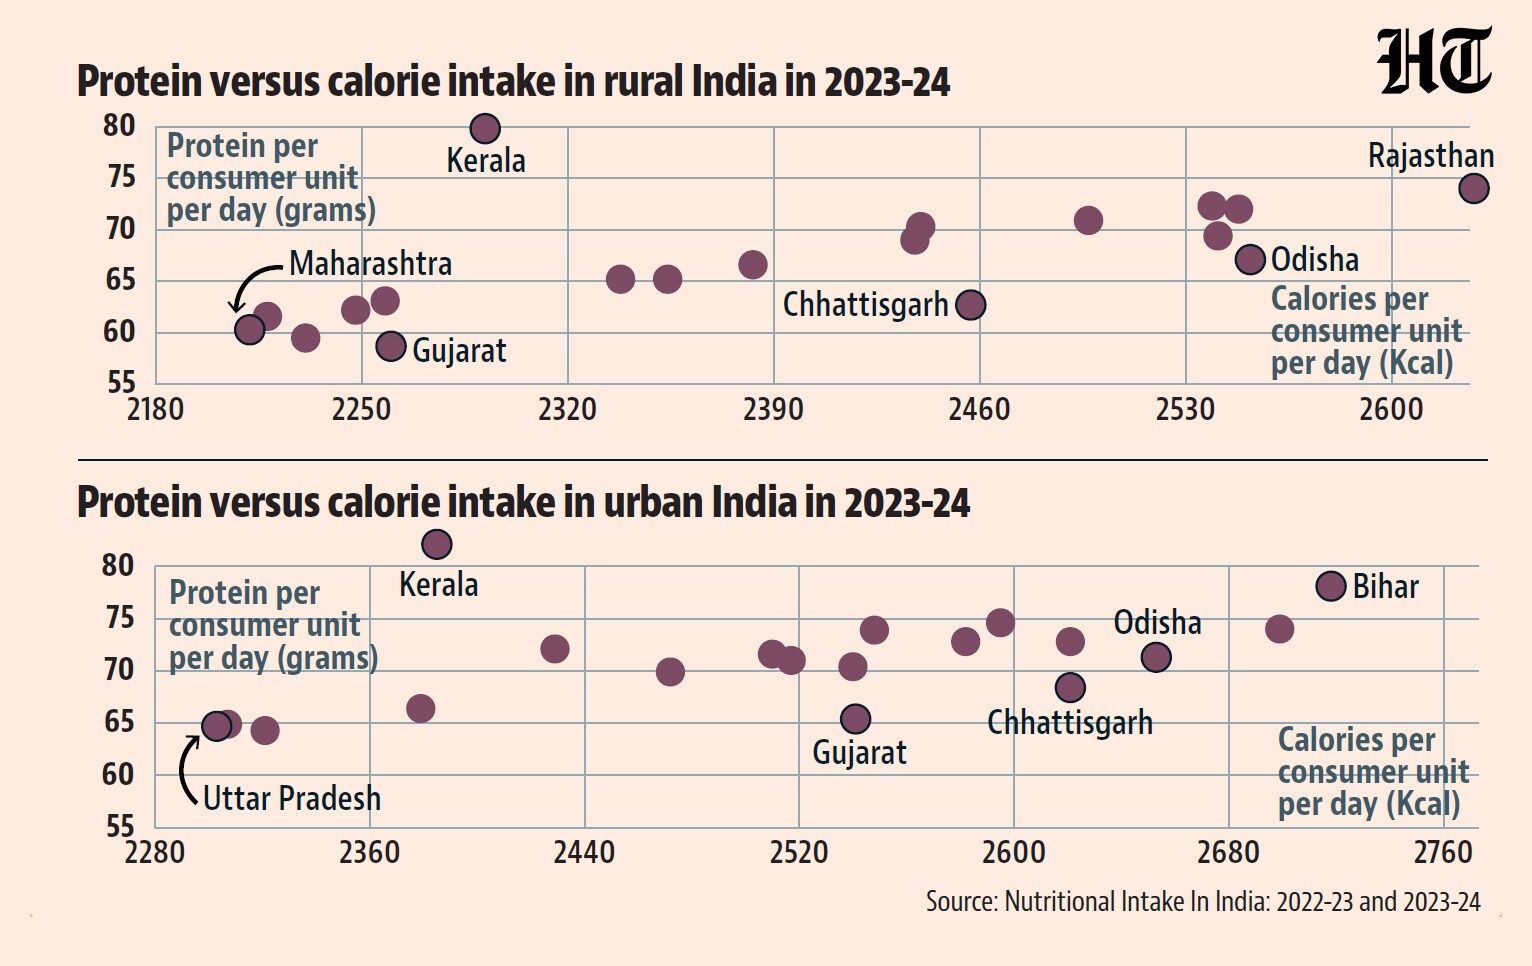
- States also show a divergent trend between protein and calorie intake levels45.9% of the protein consumed by an average Indian in rural India and 38.7% in urban India comes from cereals, which also account for 48% and 40.6% of their average calorie intake. This is exactly why calorie and protein intake levels show a very strong correlation across class in India. However, even this relationship weakens when it comes to the state-level trend. For example, Kerala’s protein consumption is the highest among major states but its calorie consumption is relatively lower. Chhattisgarh and Odisha, both poorer than Kerala, consume more calories than Kerala, but far less protein. Gujarat eats less protein than Kerala, but more calories than Kerala in urban areas. A similar discrepancy can be seen between calorie and fat consumption across states as well. Is this a result of different food habits where states such as Kerala show a higher protein consumption because of eating more fish and meat? Answering this question with certainty may not be possible even with unit-level data of the HCES, since it has clubbed some food items whose nutritional content has been published separately. Therefore, it is not possible to calculate the nutritional intake for a household using unit-level HCES data.
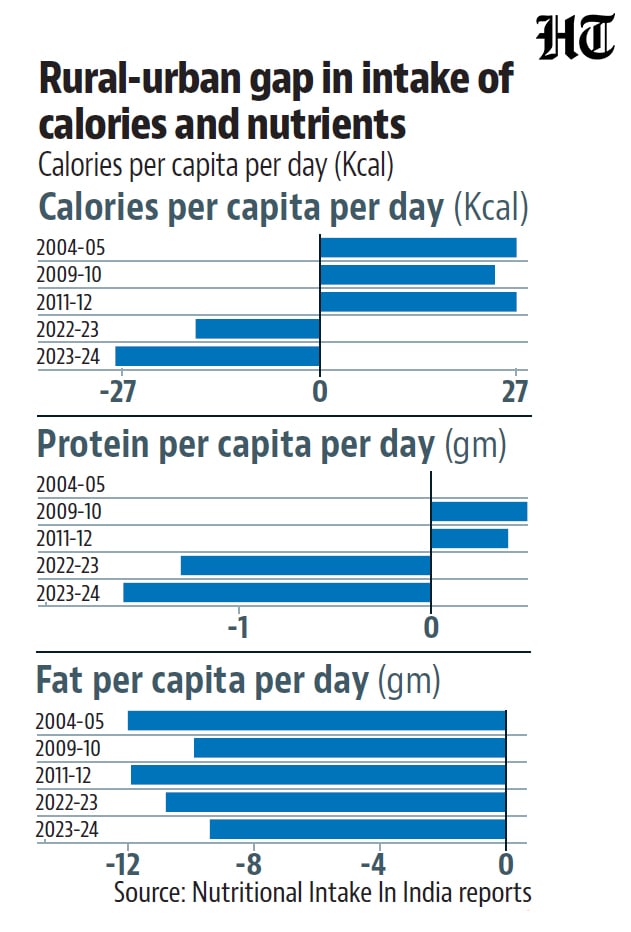
- The different trends in rural-urban gap for calorie, protein and fat consumptionThis is another interesting trend in the data. In the 2004-05, 2009-10, and 2011-12 nutritional intake data, rural areas reported a higher calorie and protein consumption than urban areas. Average fat intake levels, on the other hand, were higher in urban areas. This trend seems to have reversed in the latest data. It is urban areas that now show a higher calorie and protein intake than rural areas and the fat intake gap between urban and rural areas seems to be falling. As far as overall consumption expenditure gap between rural and urban areas is concerned, it has fallen significantly in the latest CES rounds compared to earlier rounds.


Unlock a world of Benefits with HT! From insightful newsletters to real-time news alerts and a personalized news feed – it's all here, just a click away! -Login Now!


