
 E-Paper



Delhi’s air crisis: Who pollutes, who suffers?
Delhi’s air crisis: The poor are more vulnerable to ill-effects of pollution than the rich. The richest 10% of the population pollute 10 times as much as the poorest 10%.

 Prefer HTon Google


Monu, a 13-year-old living in a Delhi slum near the Yamuna river, was exposed on a particular day to an average of 150 micrograms per cubic metre (very poor) of PM2.5 while it is 35 (satisfactory) for 11-year-old Aamya, who resides in an apartment in a colony in GK-II in Delhi. So said a multimedia story (https://tinyurl.com/5au2kccx) by The New York Times in December 2020. Aamya and her family have access to air purifiers at home and in school even as her exposure to outdoor pollution is limited by air-conditioned cars, while the same doesn’t hold true for Monu.
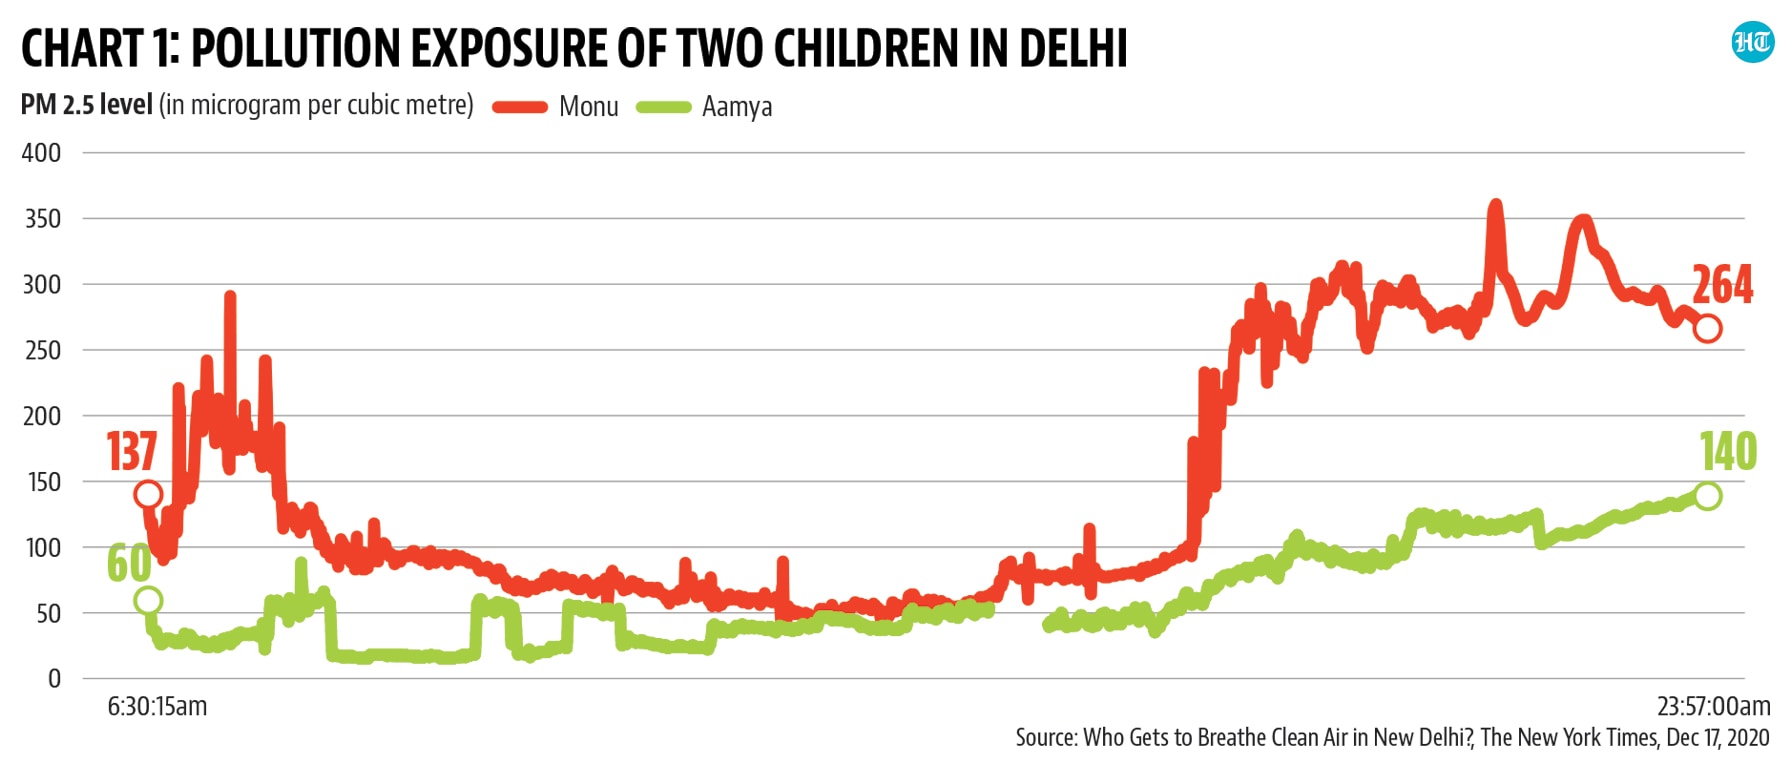
Chart 1 shows the exposure to PM 2.5 for both these children over 24 hours. As a result, Monu risks losing almost 5 years of his life, while Aamya half a year of hers. Both are avoidable. But how? The next three charts look at the problem of pollution from the lens of class and discuss possible ways out.
What pollutes?
Pollution is measured by the Air Quality Index (AQI), which is calculated separately for eight pollutants — PM10, PM2.5, nitrogen dioxide, sulphur dioxide, carbon monoxide, ground-level ozone, ammonia, and lead — and the highest of these subindices is reported as AQI for that particular day. Since these pollutants are related to each other, controlling one will help control the others too. Instead of tracking all pollutants, the policy could focus on PM2.5, which measures all aerosols under 2.5 micrometers in diameter (our hair is almost 30 times as thick) and has contributions from all the other gaseous components.
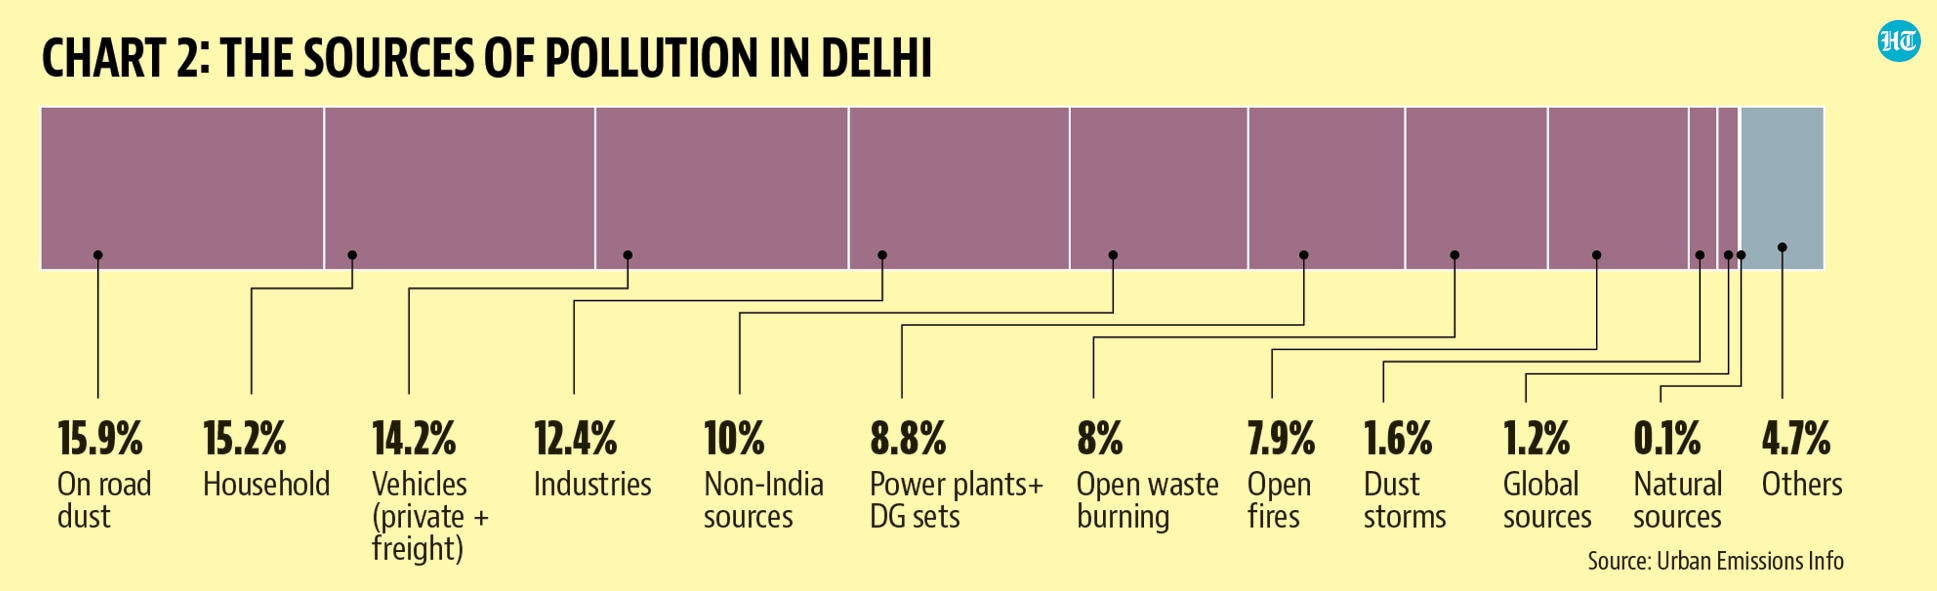
Chart 2 shows the source attribution for PM2.5. Three major contributors to pollution from the consumption side are — transport (private and public), fuel and electricity, and construction. Based on these numbers, 60% of AQI is contributed by consumption. But if these are the major sources, shouldn’t AQI remain similar through the year? It gets worse in winters not only because of stubble burning but also, among other factors, natural factors such as Delhi being shaped as a bowl, which traps pollutants for far longer as a result of the wind slowing down during the winter months.
Who pollutes?
It is beyond obvious that the affluent classes, as a result of their consumption patterns, pollute more than the poor but is it possible to quantify their respective contributions? It is difficult to provide an accurate measure but an approximate one can be derived from National Sample Survey (NSS) consumption data, which provides data on consumption of different deciles. We categorise different commodities in the consumption basket from the 2011-12 Consumption Expenditure Survey of the NSS according to the above mentioned three major sources of pollution. Based on the consumption basket of each decile and weighing them according to the shares of these three sources, we arrive at each decile’s share in total pollution. In chart 2, we show the share of each decile in the total pollution in Delhi. Chart 3 shows that the richest 10% of the population pollute 10 times as much as the poorest 10%.

Who suffers?
While all residents face the adverse health effects of pollution, the poor are more vulnerable to its ill-effects than the rich. This class difference comes out starkly in pollution related death data. NFHS does not generally provide reasons for death but in one of its rounds — the second (1998-99) — it had a question on the cause of death and two respiratory ailments were listed, both of which have a direct link to pollution: asthma and tuberculosis. This paper published in World Development (https://tinyurl.com/zhmp2evr) measured the difference in mortality across income groups. We club the classes in NSS to correspond to the NFHS category, using the above-mentioned paper’s methodology, to present a class funnel of contribution to the problem and its resulting effects (chart 4). While the contribution looks like a funnel with the high-income category polluting the most (chart 4 -a), the burden of death falls unduly on the bottom (the two pyramid like structures in chart 4-b). Those who contribute the least to the problem bear the maximum brunt of it.

What is to be done?
The pollution crisis needs a systemic solution. Lockdowns are no solutions, nor are the symbolic odd-even schemes or “red light on, engine off” placards at the traffic signals. We need to hit at the source of it — commodities that pollute and the classes that consume most of it. But how does one do that?
Some of these solutions are low-hanging fruits. Energy efficiency in India is one of the lowest in the world, which means for every unit of consumption, a lot of energy is wasted. To give an example, air conditioners running in houses/offices with poor or no insulation would invariably mean higher consumption of electricity and more pollutants in the air. Government of India estimates (https://beeindia.gov.in/content/buildings) show that at least 30-40% of energy can be saved purely by retrofitting, insulating buildings and offices, steps which can be incentivised through policy.
Some other solutions are more difficult but much needed. Delhi needs to consider a pollution tax . It can be levied at the source of energy usage — fuel and electricity — since that is the easiest to implement. Additionally yearly excise tax on cars, high parking charges as well as congestion charges can be implemented. A part of this tax needs to be spent on overhauling the public transport infrastructure of the city with dedicated bus lanes to ensure reliability, a much larger fleet of buses, cycle lanes (to ensure last mile connectivity) and pedestrian-safe pavements. Driving cars should become expensive but only after a better, cleaner, and, most importantly, reliable alternative has been provided.
The problem with such a tax is that the burden will fall unduly on the poor since they will be paying the same price as the rich for a given commodity. To address this regressiveness, one could implement a “pollution tax and clean dividend” policy. The tax collected, after deducting the infrastructural spending, is distributed equally among all citizens of Delhi as a “clean dividend”. The poor will gain at the cost of the rich. Let’s say a pollution tax of 100 is collected of which the rich have contributed 80 since their overall consumption is much higher than the poor, who contribute 20. After spending, say 40 on infra, when the remaining 60 is distributed as a clean dividend equally, they get 30 each, which means a net gain of 10 for the poor. In reality, this net gain will be even higher since their proportion in the population is generally higher. This clean dividend can be in cash or kind. If implemented in kind, it could be in the form of access to commodities such as food through ration shops, electricity, health and transport up to a certain amount.
We suggest the implementation of pollution tax to be staggered and only after the infrastructure is in place. This is for two reasons. The onset of a sudden high tax may not be acceptable to most people, as was the case in France with the “yellow vest” movement. However, if people receive benefits from Day One, including infrastructural development, and are then presented with a gradual tax, they will be more likely to buy into it. Delhi residents, especially the wealthy, need to be convinced that current and future inhabitants of the city, especially their children, will have a healthier life with the implementation of such a clean and just policy.
Rohit Azad is an assistant professor of economics at Jawaharlal Nehru University. Shouvik Chakraborty is an assistant research professor at the Political Economy Research Institute, University of Massachusetts Amherst


