E-Paper



Number Theory: Karnataka’s skewed economic geography
Even though Karnataka is among the richest states in India, its wealth is not equally distributed geographically. These charts aim to describe this inequality
Updated on: Jun 11, 2023, 21:57:21 IST


Share via


Copy link

Campaigning for the upcoming assembly elections in Karnataka has ended. During the campaign and in their election manifestoes, the two main political parties — the Bharatiya Janata Party (BJP) and the Congress — made promises to a wide range of economic groups. For example, both have promised free foodgrain to the poor.

Both have also made promises to what is likely to be a rich class: the Congress to government employees who might benefit from the Old Pension scheme and the BJP to apartment dwellers in Bengaluru. While these promises may or may not be their most important ones, they highlight the need to cater to a wide range of economic classes.
The charts that matter
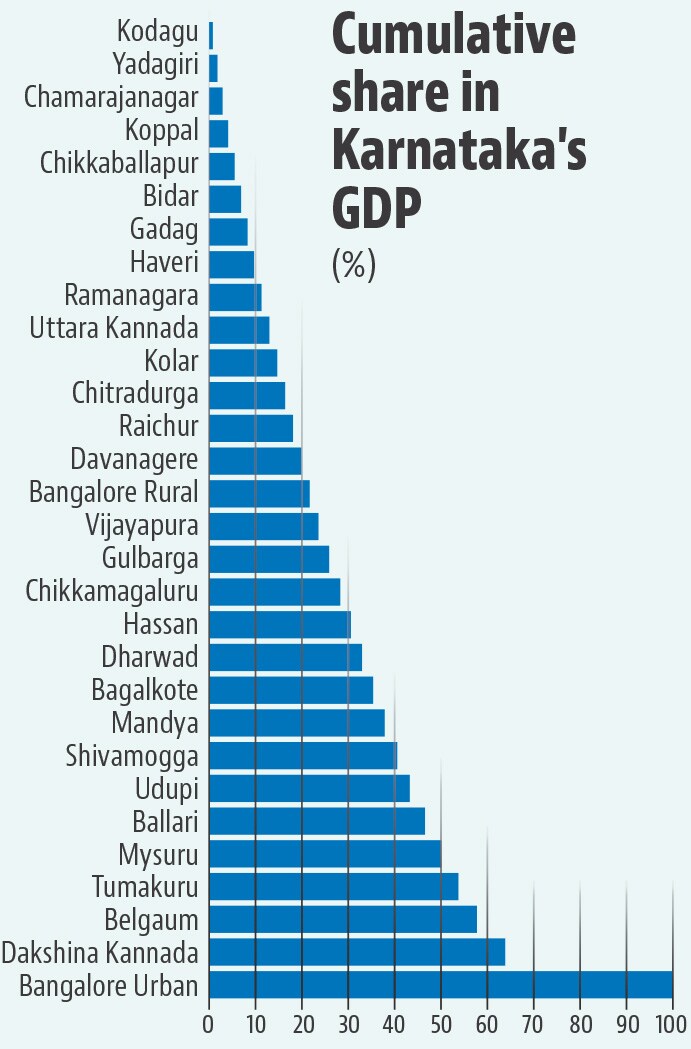
 Karnataka’s economy is heavily skewed…Karnataka is among the top five states by both GSDP and per capita GSDP among states that contribute at least 1% to India’s GDP. This makes it obvious that it is a rich state. However, most of the state’s income comes from just a handful of its 30 districts. Just 10 districts produce two-thirds of the state’s GDP. Just one district -- Bangalore Urban -- produces one-third of the state’s GDP.
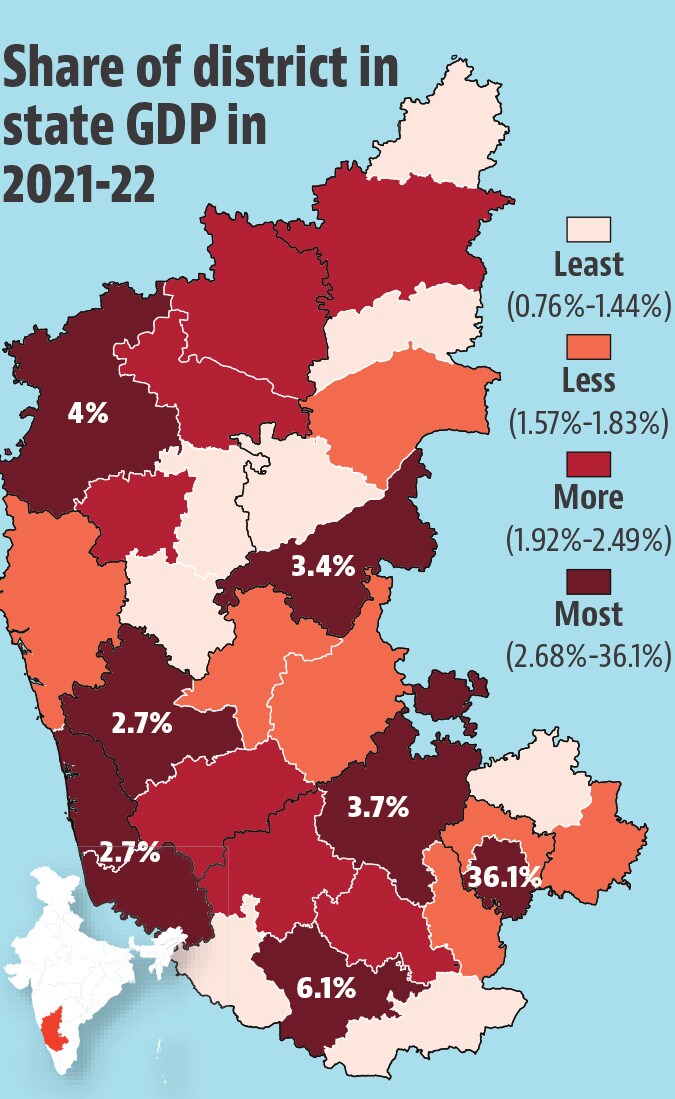
- …with a north-south divide in GSDP contributionThe chart above makes it clear that the economic weight of the state rests with very few districts. Is there a geographical pattern to it? Yes. The districts in the top quartile of GSDP contribution appear to be concentrated in the southern half of the state and those in the bottom quartile appear to be concentrated in the northern half of the state.
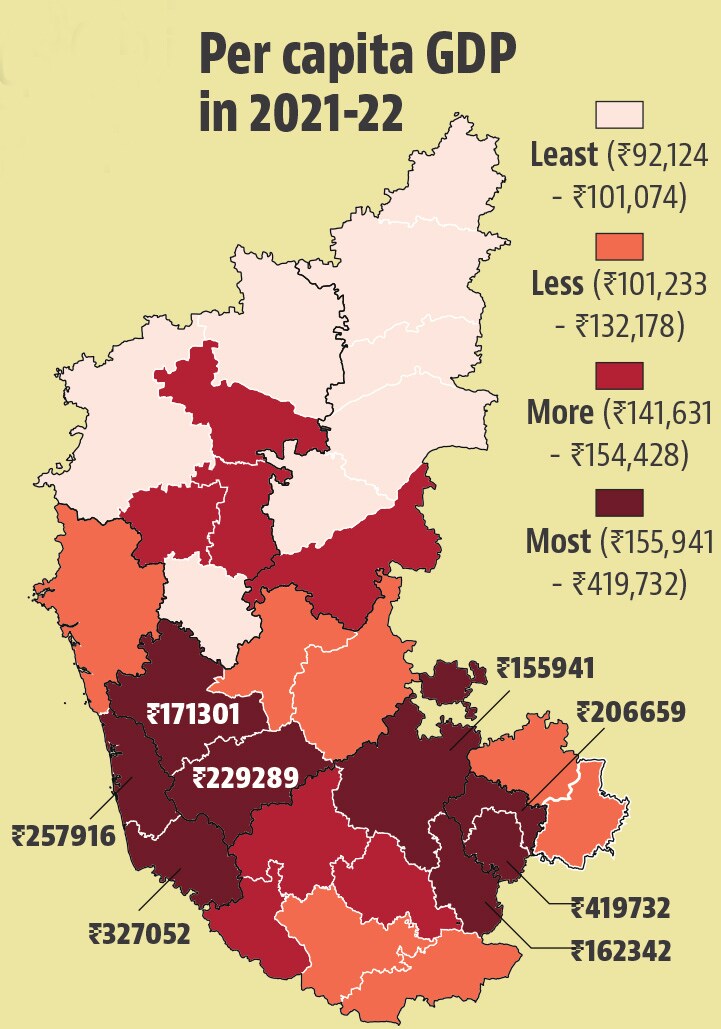
- The north-south divide is starker for per capita GDPTo be sure, a district can make a high contribution to GSDP just by having a large population. Even a small value addition per person can then add up to a lot for the state there. However, small value additions per person -- through farming, for example -- are unlikely to make individual people rich in the state. This is indeed the case with some districts in Karnataka. For example, Bijapur, Gulbarga, and Belgaum districts on the north-western border with Maharashtra make significant contributions to the state GDP. They are ranked 15th, 14th, and 3rd among the 30 districts by their share in state GDP in 2021-22. However, all are in the bottom quartile of districts by per capita GDP. Therefore, the ranking of districts by per capita GDP shows a starker north-south divide than overall GDP of districts. To be sure, this divide is not just the result of lopsided development in the recent period. Karnataka inherited this geographical divide when it was created on linguistic lines. The districts that were part of the Hyderabad State and Bombay State were poorer compared to the Old Mysore State and this pattern persists until today.
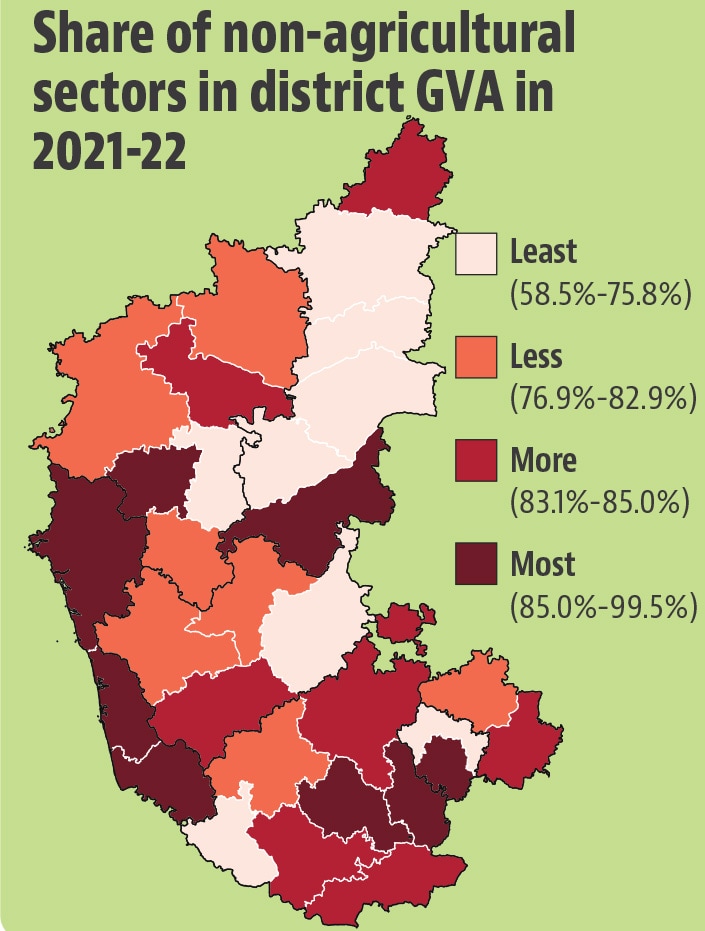
- This is likely because of concentration of non-agricultural sectors in the south...As the section above explains, a high share of people working in sectors that do not create high income can decrease the average wealth of a district. This appears to be one of the reasons behind the north-south divide of wealth in the state. Although there is no strict correlation, the proportion of non-agricultural sectors in district GDP also follows a north-south divide. To be sure, this is not as stark as per capita GDP.
- ...but that does not mean services sector alone drives up incomes in the southIf not non-agricultural sectors’ share, is the share of services in district GDP correlated well with per capita GDP? This assumption makes sense because the tech capital of India – Bangalore – contributes one-third of the state’s GDP and is in the southern part of the state. However, it is not a correct assumption. For example, Tumkur and Dakshin Kannada in the southern half of the state have high per capita GDP, but services have very low importance in these districts. On the other hand, manufacturing has a high share in the GDP of these districts, leading to a high overall share of non-agricultural sectors. Clearly, it is the distribution of remunerative industries along with services in the state that is behind the geographic inequality that persists even today.