E-Paper



Number Theory: North-east, Delhi have biggest rain shortfall this year
This is the 20th highest cumulative rainfall for this period since 1901, the earliest period for which data is available with the Indian Meteorological Department (IMD).


In India, June 1 to September 30 is officially considered as the monsoon season. The actual amount of rainfall during this period varies from year to year. The first month of the monsoon this year has been exceptionally good – in total, monsoon rainfall until June 27 this year (up to 8.30am) is 173.15 mm.
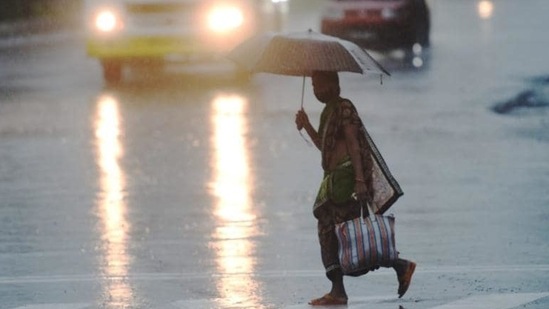
This is the 20th highest cumulative rainfall for this period since 1901, the earliest period for which data is available with the Indian Meteorological Department (IMD).
To be sure, not all parts of India have received abundant rains. Delhi, which is perhaps having the worst phase of an extended summer season right now, is among one of them. But it is not the only rainfall deficit region. North-eastern states have the biggest rainfall deficit this monsoon season. Here are four charts which summarise the progress of the monsoon so far.
Windfall gain in cumulative rainfall seems to be evaporating
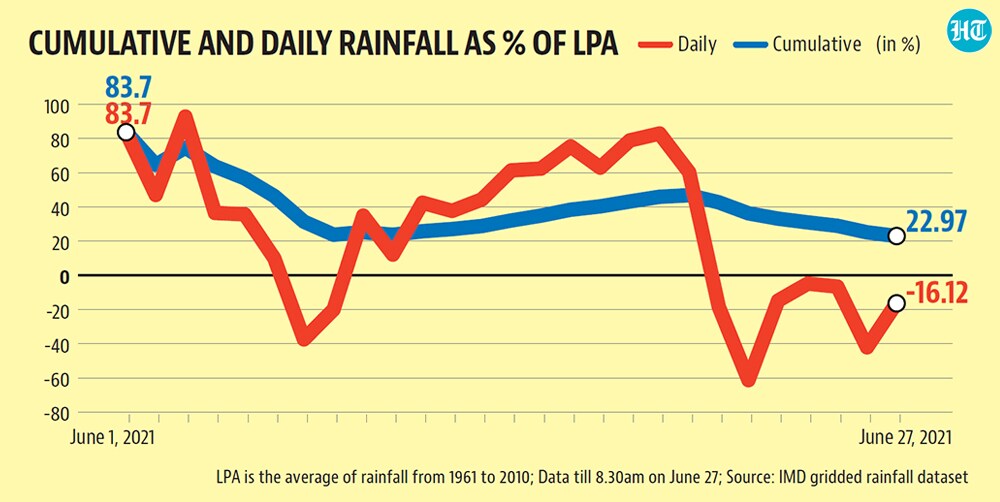
Because rains vary each year, the standard practice to measure yearly variation is to compare a year’s rainfall with what is called the Long Period Average (LPA). This is the rainfall over a region in a given interval averaged over a long time period – IMD currently uses data from 1961 to 2010 as LPA. The year’s monsoon began with a bang. Rainfall on June 1 was 83.7% more than the LPA and 18th highest in absolute terms since 1901. However, it lost momentum in the first week – on June 8, cumulative rainfall was 23.8% more than LPA. This mark-up increased to 46.8% by June 20 and was at 22.9% on June 27. As stated above, cumulative rainfall so far is the 20th highest since 1901.
The headline rainfall number hides regional variations
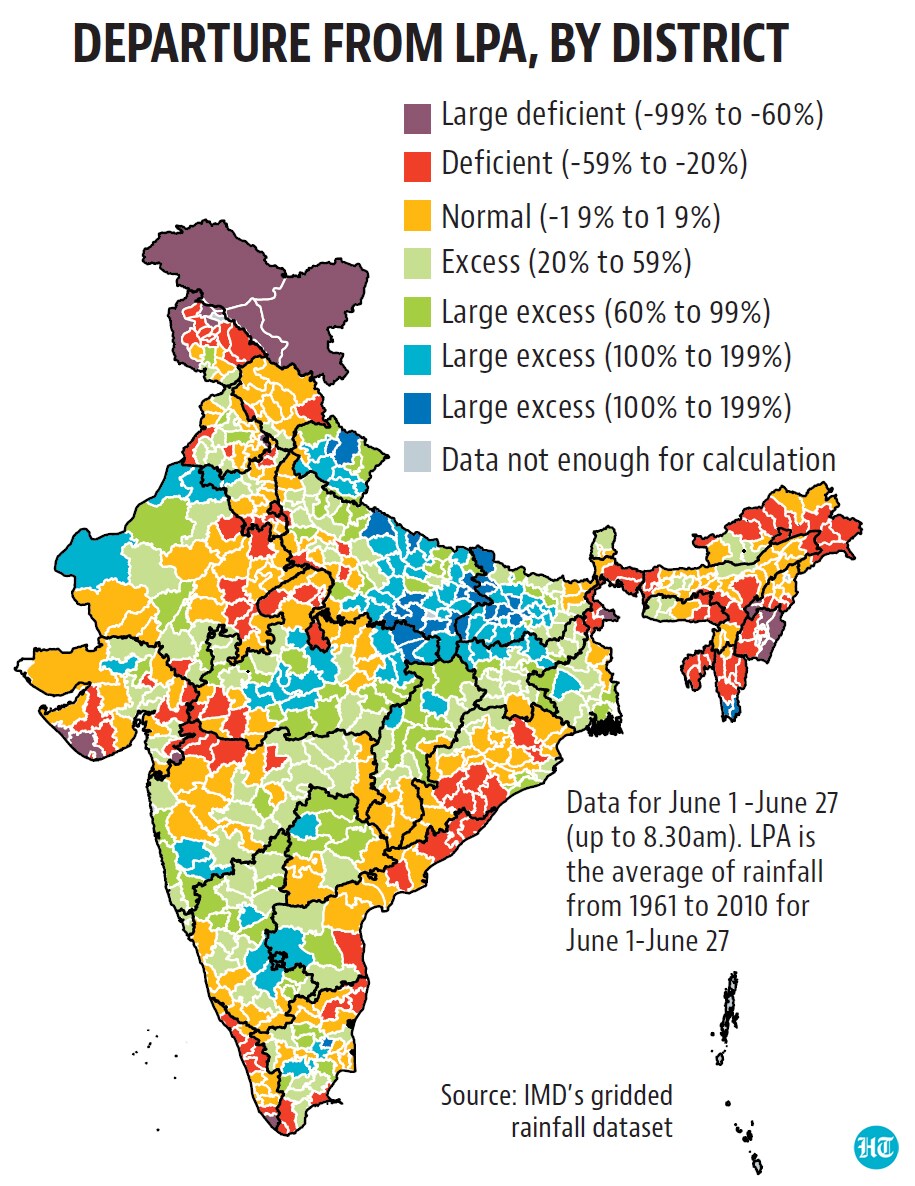
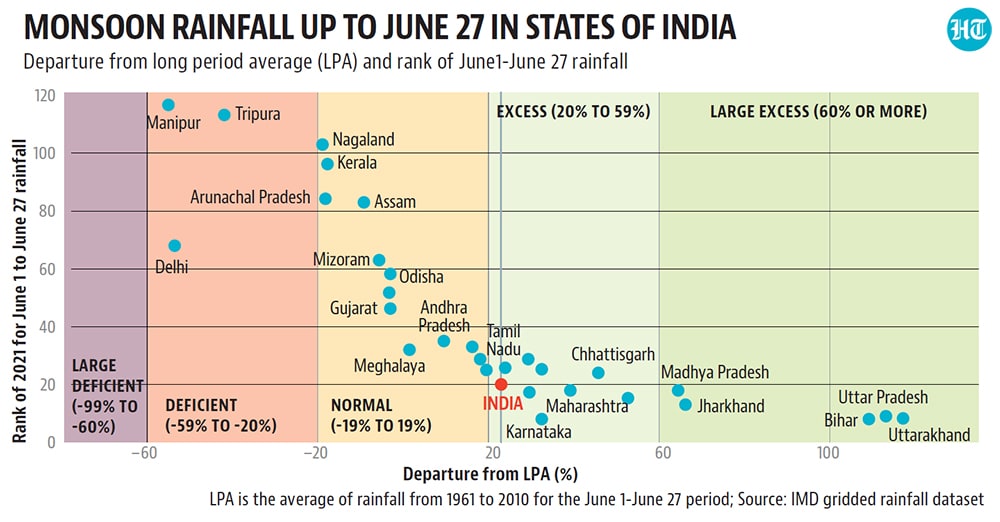
Not all regions have received higher than usual rainfall though. An HT analysis of IMD’s gridded database – each grid is a box covering 0.25 degrees longitude and latitude on the map – brings this out clearly. Of the 613 districts in the 2011 census (Delhi’s districts merged as one, while 19 districts are too small or irregular in shape to be captured by a grid) for which this calculation is possible, 305 have received “excess” to “large excess” rainfall compared to the LPA. The remaining 308 districts have received “normal” to “large deficient” rain. Most districts with a large excess of rainfall so far are located in the gangetic plains or in central India. “Large excess” rainfall has been reported in 12 of 13 districts in Uttarakhand, 41 of 71 districts in Uttar Pradesh, 27 of 38 districts in Bihar, 10 of 24 districts in Jharkhand, 4 of 19 districts in West Bengal, and 23 of 50 districts in Madhya Pradesh.
At the state level, Manipur has the biggest shortfall in cumulative rainfall, while Delhi is ranked second. Many other north-eastern states also have a deficit rainfall when compared to the LPA. To be sure, a higher percentage deficit with the LPA does not tell us anything about the actual rainfall in a region, because LPAs themselves vary drastically. For example, even with a 57% deficit from LPA, Manipur cumulative rainfall is 109.7 mm, much more than Delhi’s 23.32 mm which has a 53.1% deficit from LPA.
Heavy rainfall days have not seen a big jump so far
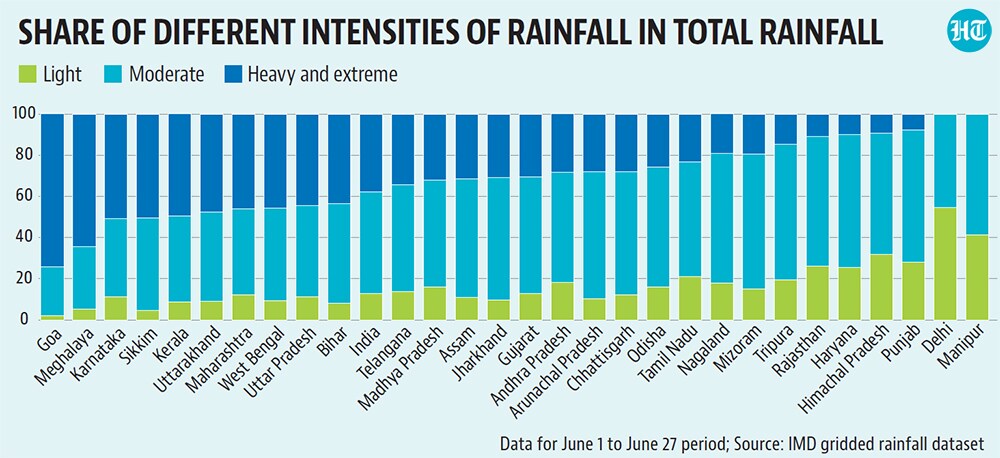
The nature of rain matters as much as the quantity of rain in a monsoon season. Theoretically, cumulative rainfall will be the same whether it rains in short spells consistently, or very heavily over just a few days. Heavy rainfall also causes damage such as flashfloods and waterlogging. The IMD actually classifies rainfall as light intensity (or of 7.5mm or less in 24 hours in a grid), moderate intensity (7.5mm-35.5 mm in 24 hours in a grid) and heavy and extreme intensity (greater than 35.5mm in 24 hours in a grid). An HT analysis shows that in absolute terms, it is light and moderate rain, which has been exceptionally high this year – ranked 5th and 10th highest respectively since 1901. Heavy and extreme rainfall this monsoon so far is only 37th highest. In terms of the share of these intensities in total rainfall, the share of heavy and extreme rainfall is the 24th lowest. As is to be expected, there are regional variations here as well. The share of heavy and extreme rainfall this year is the 10th highest since 1901 in Uttarakhand, and 22nd highest in Bihar and 25th highest in Uttar Pradesh.