E-Paper



Number Theory: Four questions which will define the 2024 elections
Here are four charts that describe the four questions the results of this election will answer.
Updated on: Mar 17, 2024, 06:35:41 IST

 Prefer HTon Google
Share via


Copy link

The Election Commission of India (ECI) announced the schedule of the 2024 Lok Sabha elections on Saturday. The national elections will be held in seven phases from April 19 to June 1, and the ballots will be counted on June 4. Here are four charts that describe the four questions the results of this election will answer.
Will the Bharatiya Janata Party add to its 2019 seat tally?
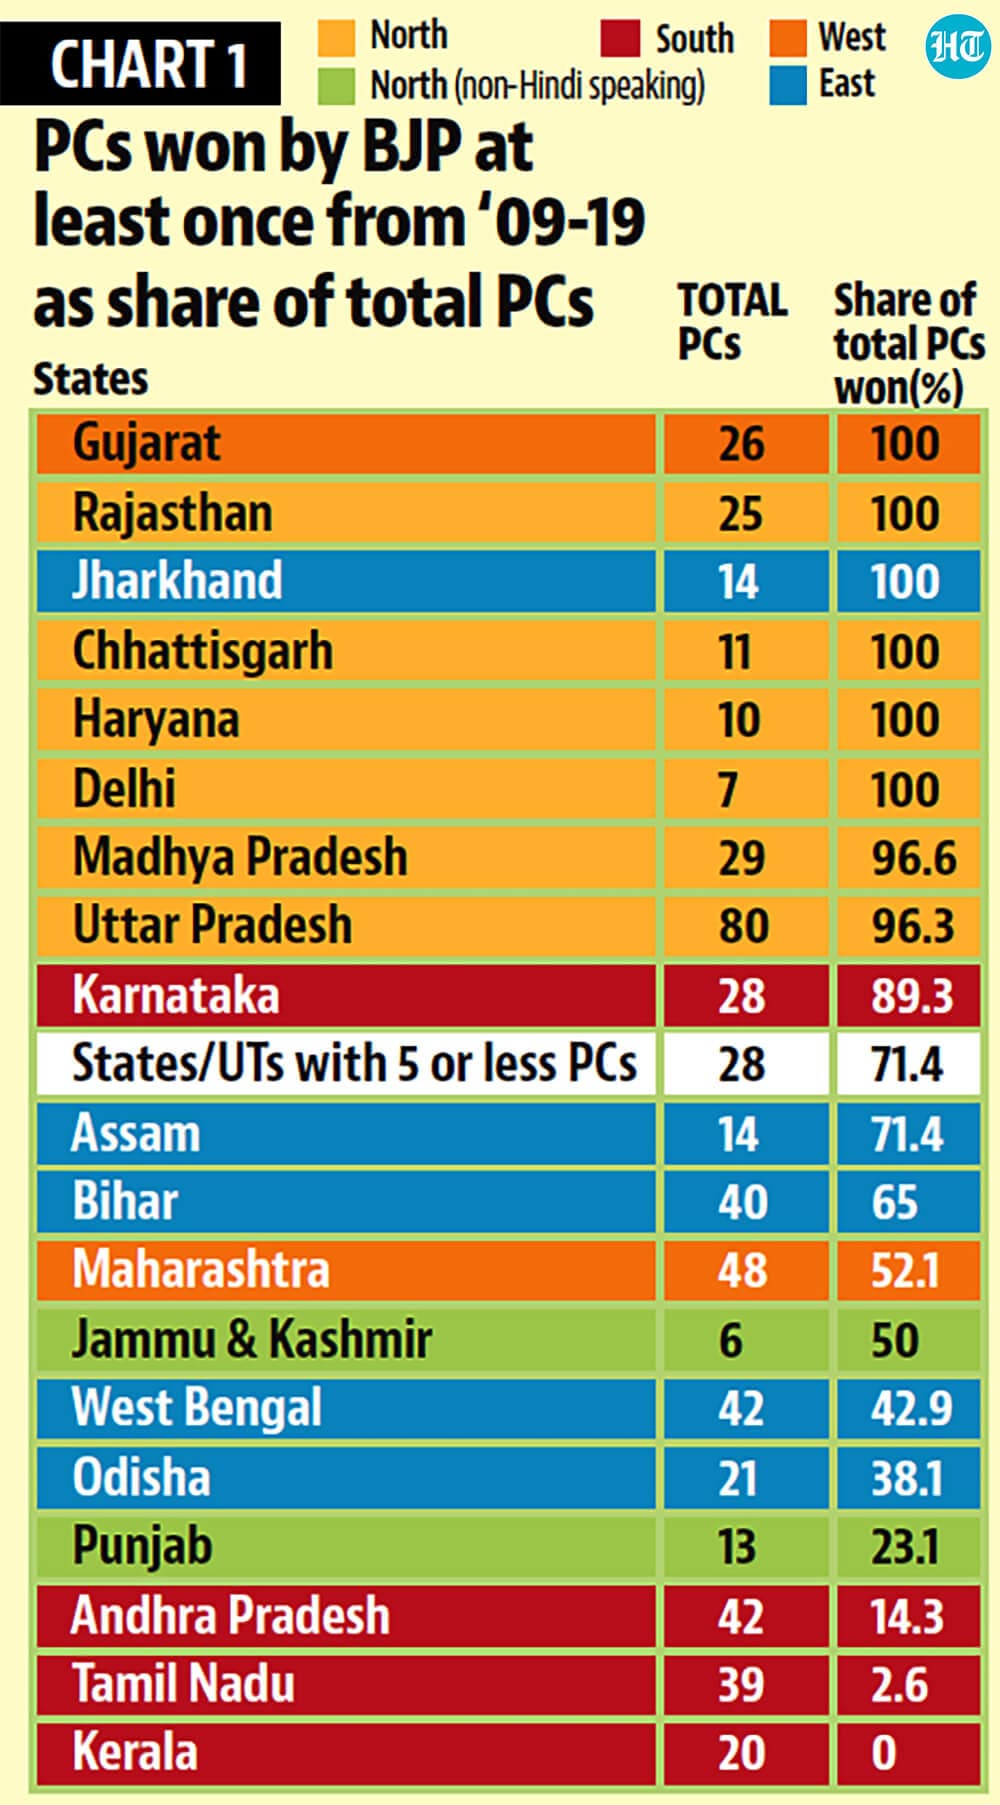
 Will the Bharatiya Janata Party add to its 2019 seat tally?This is the goal the BJP has set for itself, with Prime Minister Narendra Modi raising the party’s target to 370 seats in the Lok Sabha. Is it an achievable target? There is more than one way to look at this question. An earlier HT analysis looked at the BJP’s past victories in the 2009, 2014 and 2019 Lok Sabha elections, and found that if it was to win all the parliamentary constituencies it won in the past three polls, it would have 343 MPs in the Lok Sabha. The previous elections are not comparable because of change in constituency boundaries in the 2008 delimitation. What will it take for the BJP to take this number closer to 370? One way to look at this is to see the political geography of the BJP’s challenge of increasing its Lok Sabha strength. A state-wise analysis of constituencies won by the BJP in 2009, 2014 or 2019 shows that for it to significantly cross 343 and head towards the 370 number, it will have to increase its seat tally in the eastern and southern states. In some of these states, the BJP has never been able to perform well, while in others it is unlikely to make large gains because of seat-sharing arrangements.
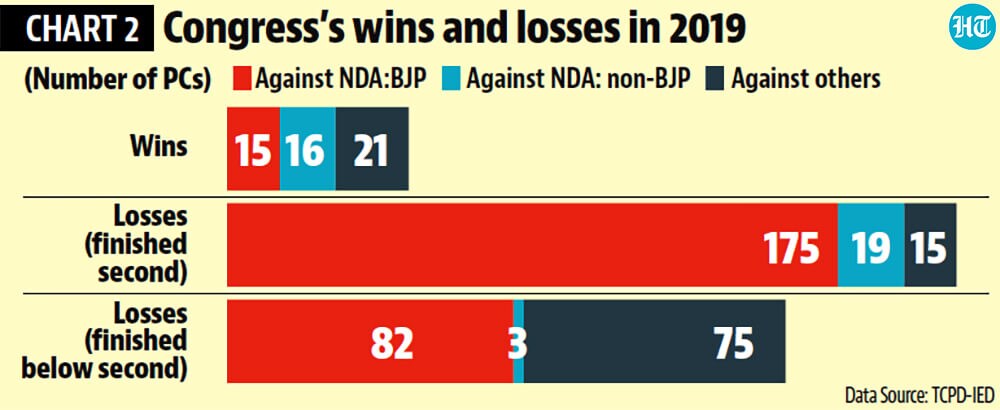
- Can the Congress improve its performance?The 2014 and 2019 election results have been the worst ever for the Congress. Will it be able to revive its fortunes? There are two aspects to this question. The Congress’s performance against the BJP and against non-BJP parties in states where the BJP is not strong. Only 23 and 15 out of the Congress’s 44 and 53 constituencies in 2014 and 2019 respectively came in contests where the BJP finished second. Two big states that contributed to the Congress’s tally in 2014 and 2019 were Kerala and Punjab, where it was not in a direct contest with the BJP. In both these states, the Congress has lost assembly elections after 2019. If the Congress has to add to its 2019 tally, it will have to either repeat or improve its performance in these two states, or make significant gains against the BJP in head-to-head contest states.
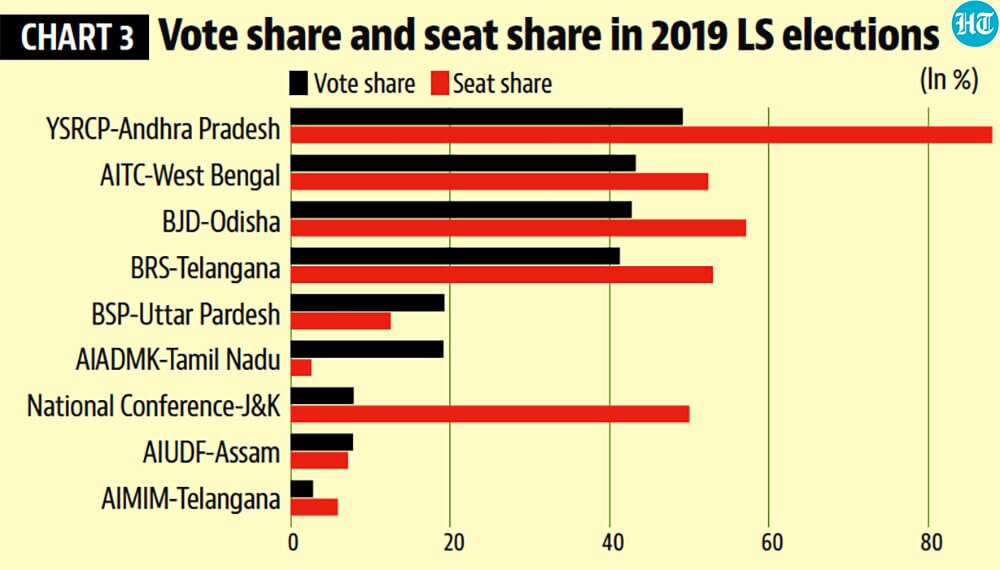
- What will happen to the non-aligned third pole in Indian politics?In the 2019 Lok Sabha elections, parties that were not a part of either a BJP- or Congress-led alliance, even if there were friendly fights in some states, won in 97 constituencies with a collective vote share of 27.8%. Will this third pole continue to hold after the 2024 polls? The answer to this question will depend on the performance of the Trinamool Congress in West Bengal (technically it has not quit the INDIA bloc, but is contesting all seats in West Bengal alone), Biju Janata Dal in Odisha (though an alliance with the BJP may be on the cards), Bahujan Samaj Party in Uttar Pradesh, YSR Congress Party in Andhra Pradesh, Bharat Rashtra Samithi and All India Majlis-e-Ittehadul Muslimeen in Telangana, All India Anna Dravida Munnetra Kazhagam in Tamil Nadu, All India United Democratic Front in Assam and National Conference in Jammu and Kashmir.
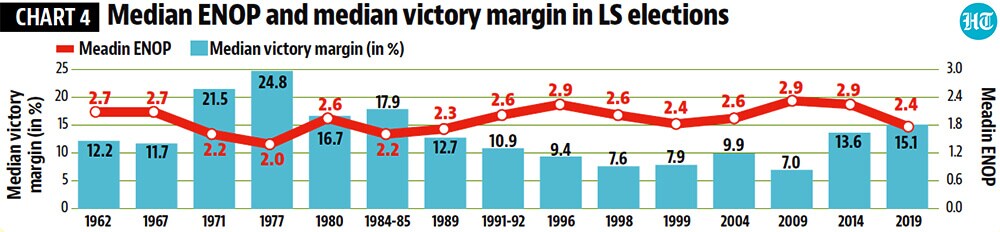
- Will electoral contests continue to become more difficult at the constituency level?This is one of the most under appreciated aspects of the change in Indian politics from 2014 onwards. Not only has the BJP become the dominant party at that level, elections are also becoming more difficult at the constituency level. An HT analysis of two sets of statistics, median ENOP (Effective Number of Parties ) and median victory margins at the constituency level show this clearly. ENOP is the reciprocal sum of squares of vote share of every candidate in a constituency. If four candidates get 25% votes each, the ENOP is 4, and if just one candidate gets 60% vote share while the other three get 20%, 15% and 5%, it drops to 2.35. The median ENOP in the 2019 elections was 2.38, which was the lowest this number has been since 1989. Similarly, the median victory margin at the constituency level in the 2019 elections was 15.1% of votes polled, which was the highest it has been since 1984-85. These numbers clearly show that whether or not parties are willing to pick sides in broader alliances, contests are becoming more polarised and perhaps one-sided at the constituency level.