E-Paper



Number Theory: JN.1 Covid sub-variant not a cause for concern
Is there any cause for immediate concern about the return of the Covid pandemic? Not really
Updated on: Dec 22, 2023, 00:26:00 IST

 Prefer HTon Google
Share via


Copy link

On Thursday, there were 594 new Covid-19 infections reported across India. Meanwhile, six more people (three from Kerala, two from Karnataka, and one from Punjab) lost their lives to the disease – the most in a single day in nearly seven months. Prompted by this, the Indian news cycle has once again started discussing the pandemic in excruciating (and often alarmist) detail. But is there any cause for immediate concern about the return of the pandemic? Not really, as shown by these four charts that highlight learnings from four years of the Covid-19 outbreak.
Covid cases are rising, but the numbers are still low
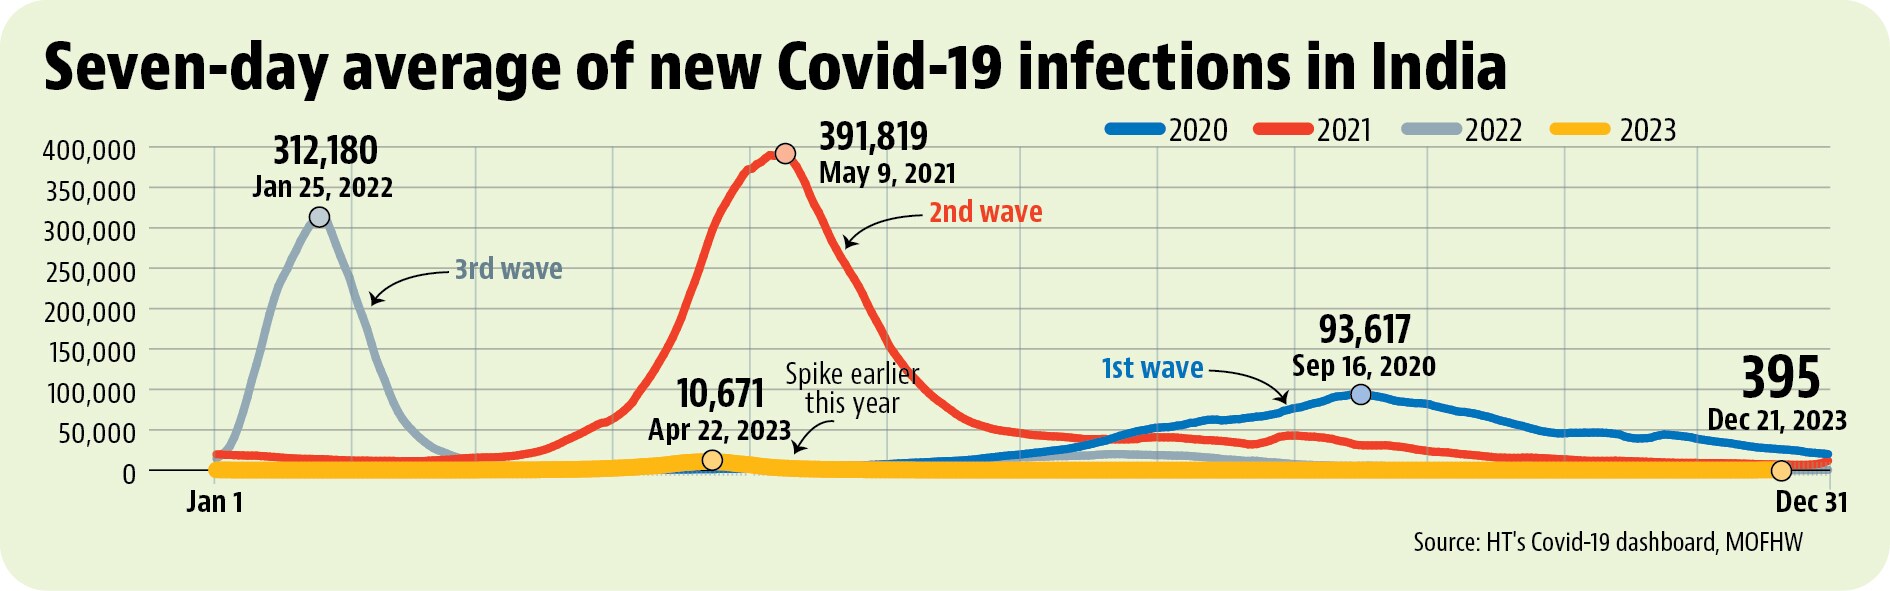
 Cases are rising, but the numbers are still lowThe most obvious way to track the outbreak is to look at the number of new infections being reported. The seven-day average of new Covid-19 infections (a statistic that is often referred to as the case rate) for the week ended Thursday (December 21) was 395, according to government data tabulated by HT. In the past few weeks, this number has been rising – a phenomenon that has garnered much public interest because it has coincided with cases of the JN.1 sublineage of the BA.2.86 variant being discovered here. A week ago, this number was 181, and it was 88 the week before that. The last time the case rate (as the seven-day average of cases is known) was this high was on May 1 when a minor surge due to the XBB.1.16 Omicron variant was dying out. But to understand if cases are actually high, one must see them against data of the past three years. While cases may be rising right now, they are dwarfed by the numbers India witnessed, not only in the three major Covid-19 waves, but also in the minor “non-wave” spikes in between. The three full-blown waves of Covid-19 peaked at weekly averages of new infections of 93,617 (mid-September 2020), 391,819 (early May 2021), and 312,180 (end of January 2022). Even a relatively small surge in April, likely caused by the XBB.1.16 Omicron variant, saw numbers far higher than this. The seven-day average of cases hit a peak of 10,553 cases on April 23 (and went almost unnoticed).
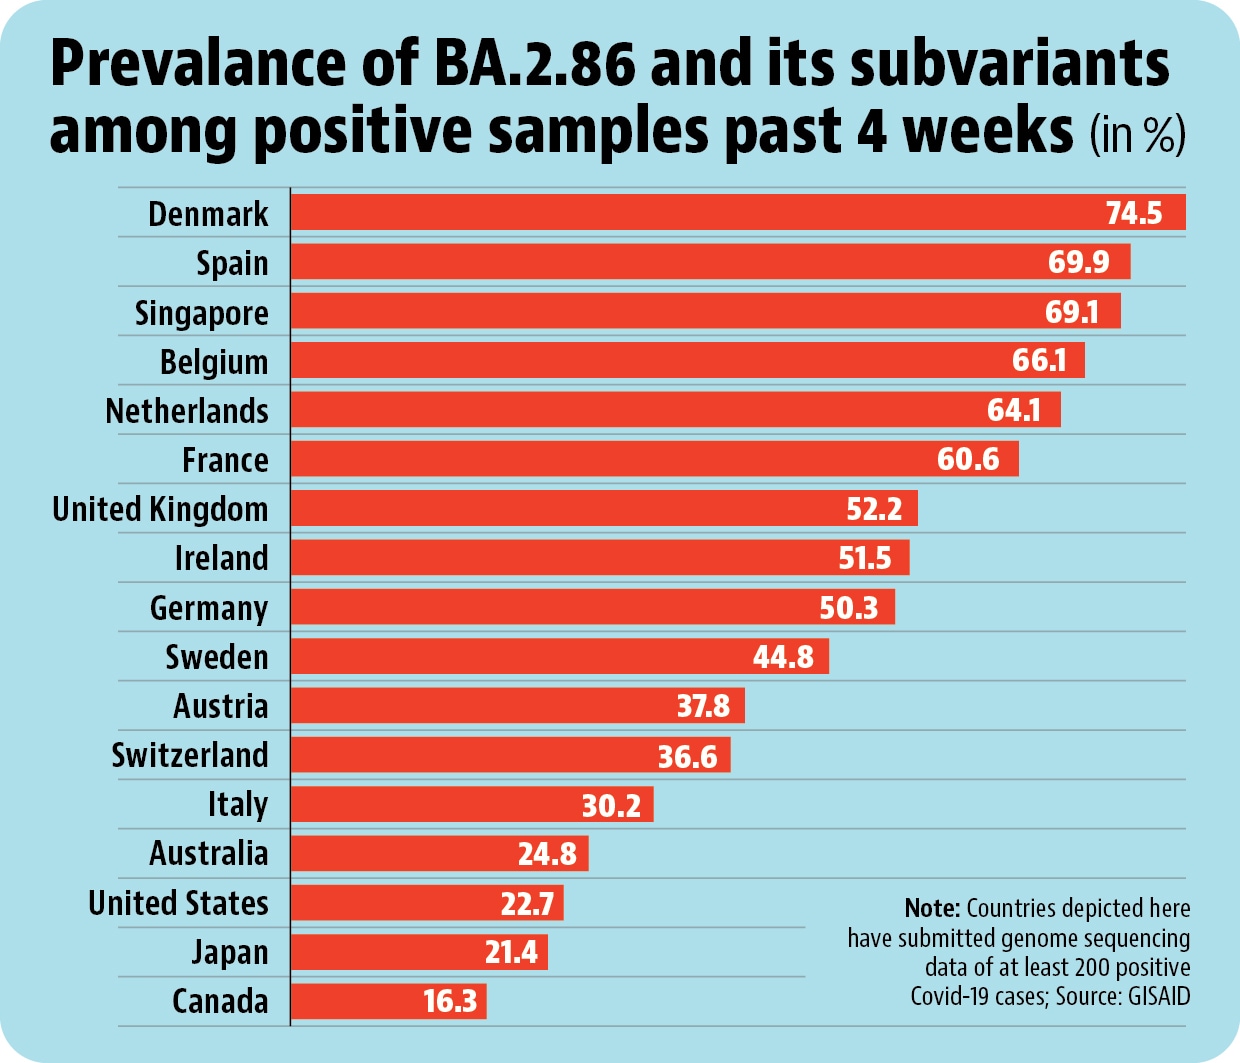
- JN.1 is infectious, and tends to become the dominant variantTo understand what lies ahead, we must also look at the JN.1 variant, which has recently been detected in the country and try to see what we know about how it behaves. JN.1, first reported in Denmark and Israel, descended from BA.2.86, which in itself was distinct from the Omicron’s XBB family of descendants. The key mutation in JN.1 is L455S in the S protein. This protein is what is responsible for hooking on to human cells and infecting them. Lab studies by Japanese researchers found that L455S can make the virus more resistant to antibodies generated by past versions of the virus. It is this immune resistance that has been the main feature of JN.1. According to data compiled by GISAID, of the total 22,205 positive cases of Covid-19 sampled across 58 countries, 45% (9,930) samples have returned positive for BA.2.86 or its sub-variants such as JN.1. Among them, eight regions — Denmark, Spain, Singapore, Belgium, Netherlands, France, United Kingdom and Ireland – have found the variant in more than 50% of positive samples they have sequenced, data shows. In four of these, over two-thirds of all samples have had this variant – highlighting how it has a high tendency to become the dominant variant in a region.
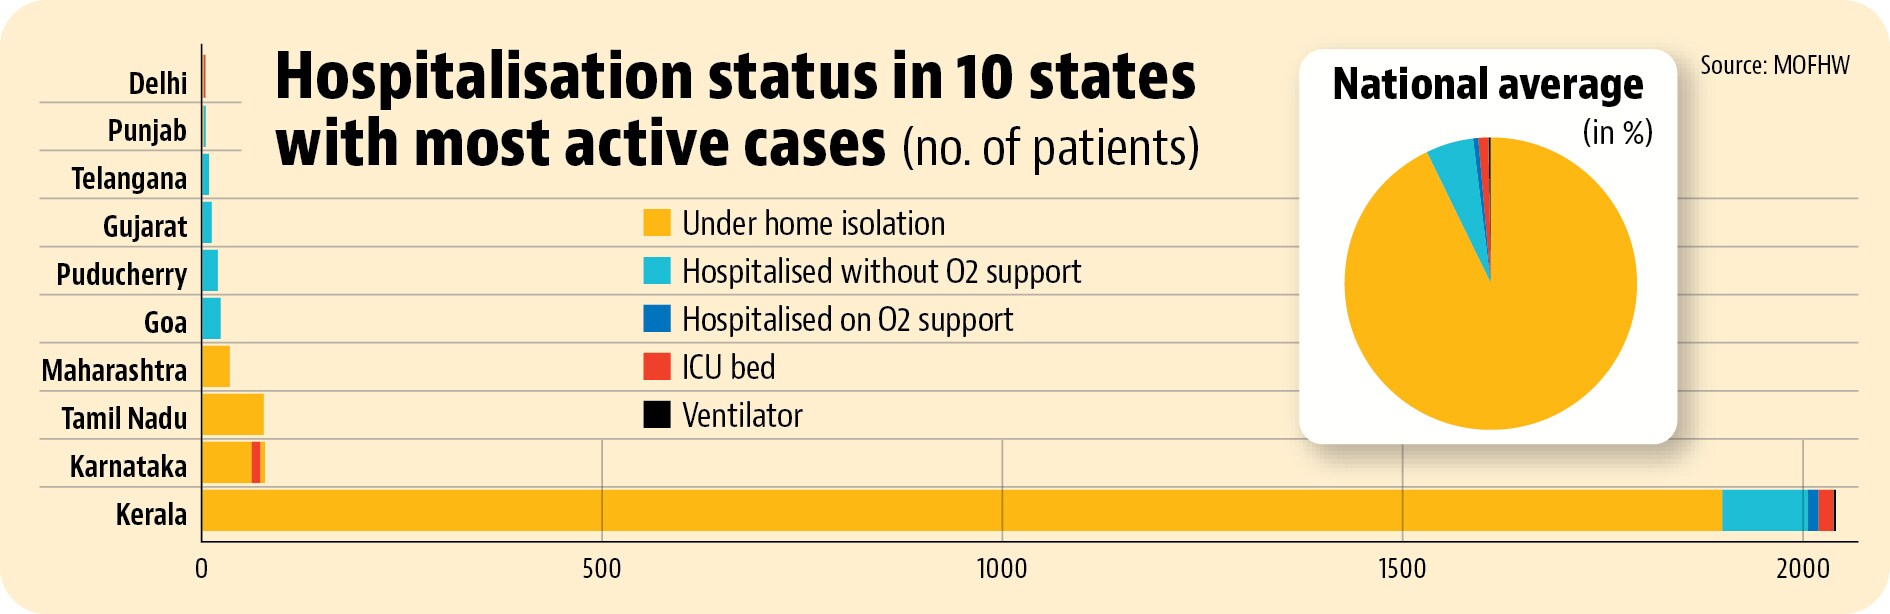
- Hospitalisation rate, like it was in the Omicron wave, remains lowOne of the more comforting sides of the current surge has been that since the Omicron wave, there appears to be no rise in hospitalisation levels. It is critical to track the rate of hospitalisations as it is key metric that serves as an early warning sign in the pandemic. In the latest surge, bulk of the new cases have been reported from Kerala, which accounts for 88% of 2,669 active Covid-19 cases across India. The latest hospitalisation data, released by the Union health ministry late on Tuesday, from the southern state serves as a good barometer for how the early days of this surge are playing out. According to this data, 93% of all active infections in the state are under home isolation, which is also the case at the national level. Only 0.64% of infected patients in Kerala currently require oxygen support. 0.9% of patients have currently occupied ICU beds in Kerala, while just 0.15% are on ventilators.
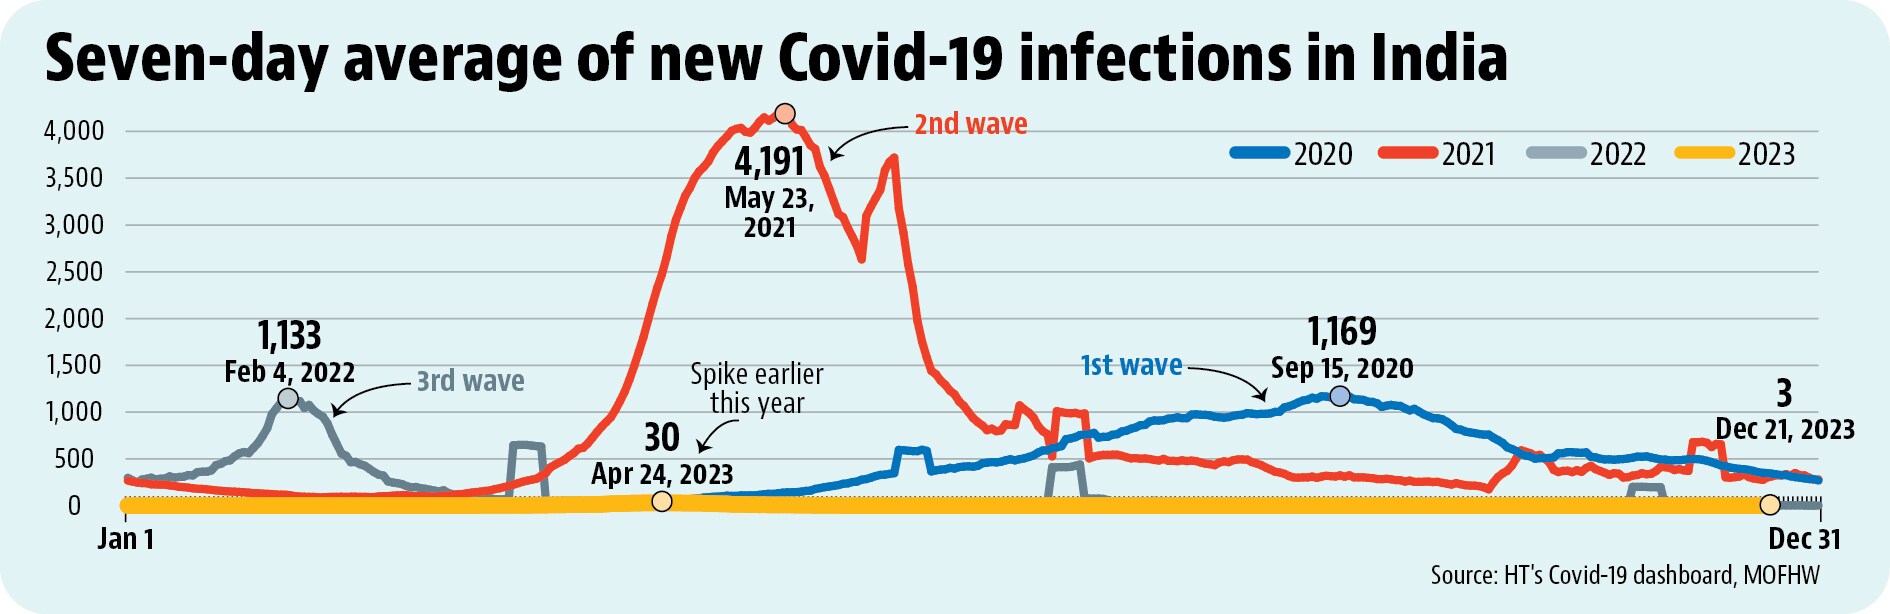
- Deaths remain low, and only among those with co-morbiditiesThe final target of any public health effort is to ensure that deaths remain low. And while the seven-day average of daily deaths has also seen a slight uptick – going from 0.6 a week ago to 2.6 for the week ended Tuesday – government officials have repeatedly stressed the numbers were largely due to people suffering from “severe co-morbidities” getting infected. This number also needs to be seen in the context of what is considered high in a country the size of India. More deaths were reported in the XBB.1.16 Omicron surge in mid-2023, which saw the death rate peaking at over 30 fatalities a day – itself a small number for a country the size of India. Again, for context, in the three major waves India has seen, the daily fatality rate peaked at 1,069 in the first wave, 4,191 in the second, and 1,133 in the third.