E-Paper



Number Theory: 3 charts that explain the Haryana, J&K election results
.
Updated on: Oct 9, 2024, 09:55:31 IST

 Prefer HTon Google
Share via


Copy link

The Bharatiya Janata Party (BJP) has retained Haryana for the third consecutive time while the National Conference and Congress alliance has managed to win a clear majority in the first assembly elections in the Union territory of Jammu & Kashmir. The results are contrary to what almost all exit polls predicted: that the Congress would comfortably win Haryana while Jammu & Kashmir would not give a clear majority to any alliance. What explains these results? Here are three charts that put things into perspective.
Number Theory
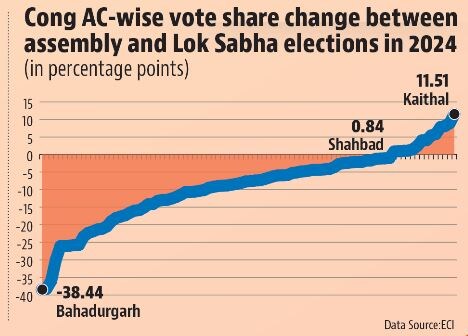
 Complacency might have snatched Haryana from the CongressThe Congress won five out of the 10 Lok Sabha constituencies in Haryana in the 2024 general elections held in May. This was a big improvement for the Congress, which won just one Lok Sabha constituency in 2014 and none in the 2019 general elections. With the momentum of 2024 Lok Sabha elections behind it, 2024 assembly contest was the Congress’s to lose. And this is exactly what happened. HT has compared the assembly constituency (AC)-wise vote share of the Congress and its alliance partner Aam Admi Party (AAP) from 2024 Lok Sabha elections to the AC-wise vote share of Congress and its allies in the 2024 assembly elections. Data shows that the Congress has seen a fall in its vote share in 79 out of the 90 ACs between May (Lok Sabha elections) and October in 2024. Even in terms of headline vote share, the Congress’s performance in the 2024 assembly elections is 4.6 percentage points lower than its contested vote share in 2024 Lok Sabha. If the Congress wants to understand why it failed to win Haryana it must engage with what happened in the last four months.
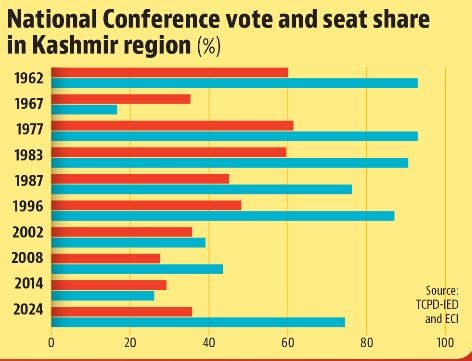
- The National Conference has made a huge comeback in KashmirIn terms of the larger polarisation of Jammu voting for the BJP and the Kashmir region voting for non-BJP parties, nothing has changed in the Jammu & Kashmir elections compared to the 2014 contest. What is remarkable about the results this time, though, is the big revival of the National Conference in the Kashmir region. With 42 MLAs in an assembly of 90 members, 35 out of which have come from the Kashmir region, this is the National Conference’s best performance in Jammu & Kashmir since the 1996 elections. It’s a big change in the electoral politics of Kashmir region, which had not given a majority of ACs to the National Conference since 1996, as was pointed out in these pages earlier. The corollary of the National Conference’s resurgence in the Kashmir region is the almost complete decimation of the People’s Democratic Party (PDP) which has managed to win just 3 ACs, its worst ever performance since its first elections in 2002. That the PDP allied with the BJP to form a government in Jammu & Kashmir after the 2014 elections is a fact which cannot be ignored if one wants to understand the PDP’s decimation.
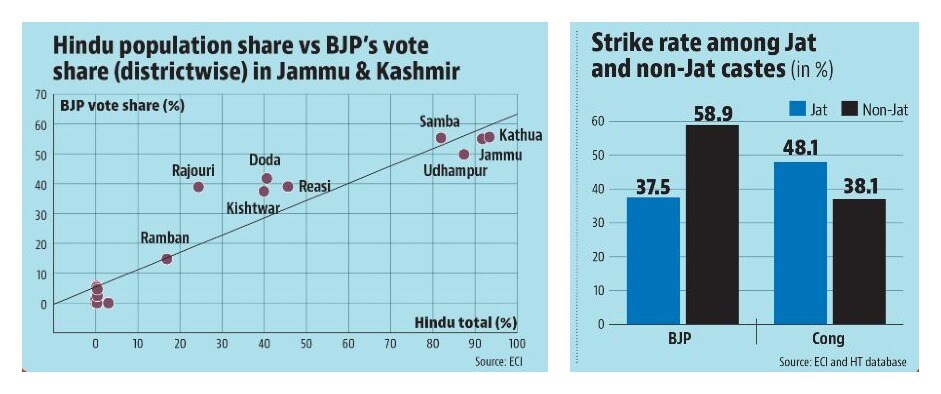
- Different polarisation stories in two statesDescriptive statistics aside, is there a larger reason which can help us understand the election results? The Haryana and Jammu & Kashmir results are best described by two kinds of social polarisation: Muslim vs Hindu in Jammu & Kashmir, and Jat vs non-Jat in Haryana. The best way to look at this data is to compare the BJP’s performance in all districts of Jammu & Kashmir by the share of Hindu population. Its strike rate shows an almost perfect positive correlation (R-square value being 0.93) with the share of Hindu population in each district. The reason the BJP has fallen short of the majority mark in Jammu & Kashmir is that 73% of ACs are in districts which have at least 50% Muslim population. In Haryana, the best way to understand the results is to look at the strike rate of the BJP and Congress by two broad groups of candidates: Jats and non-Jats. As was pointed out in these pages, the Congress alliance had fielded 27 Jat candidates while the BJP had put up just 16 of them. The strike rate of Jat candidates put up by the Congress is 51.9% which is higher than what this number is for the BJP’s jat candidates. However, the Congress is way behind the BJP in terms of strike rate of non-Jat candidates, the numbers being 37.5% and 59% respectively. The BJP’s continued effort to consolidate the non-Jat other backward class (OBC) vote has clearly worked.