
 E-Paper



America does not produce world-beating statistics. Who does?
We search for the world’s worst—and best—economic data


 Prefer HTon Google


When King Ariantas wanted to find out how many people lived in ancient Scythia, his approach to people not answering surveys was brutally simple. According to Herodotus, a Greek historian, Ariantas ordered each Scythian to bring him an arrowhead on pain of death. As the king totted up his arrowheads, he could not be sure that everybody had complied, but woe betide those that did not.

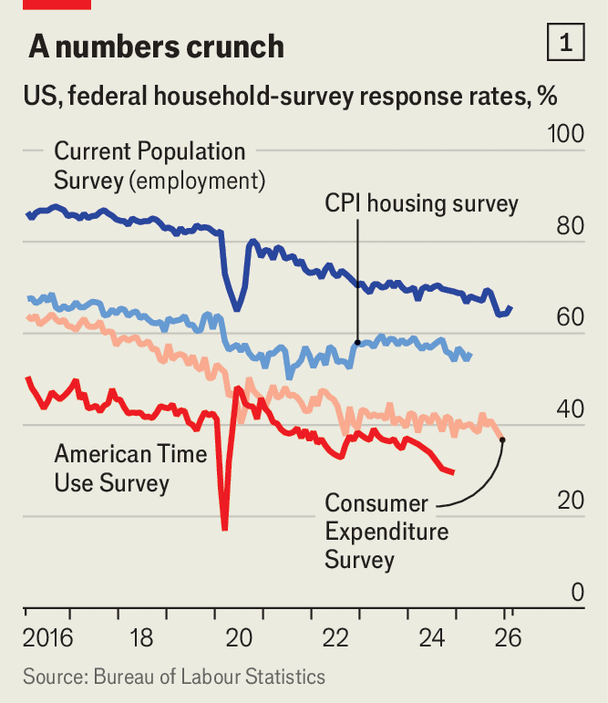
Modern-day statisticians would be forgiven for envying Ariantas’s powers of persuasion. Response rates to official surveys have collapsed globally. In America less than 40% of people reply to questions on consumer spending, down from more than 60% in 2016 (see chart 1). In Britain a paltry 27% reply to surveys about their work status. Bean-counters today also have to reckon with falling budgets, declining public trust and greater political interference. Only half of Americans have confidence in federal numbers. President Donald Trump did not help by sacking the head of America’s Bureau of Labour Statistics (BLS) in 2025, falsely claiming she had rigged a jobs report to make him look bad. Statisticians in Colombia, Poland and Slovenia have all been controversially fired in recent years.
Everyone should worry about the stats-pocalypse, not least because policy drawn up using junk statistics risks being junk itself. Central banks need reliable employment data to set interest rates. Many social benefits are linked to inflation, so if the numbers are wrong, payments will be stingier or more generous than intended. If American lawmakers had known in the last quarter of 2008 that GDP had fallen by more than 8%, at an annualised rate, rather than the initial estimate of 4%, they might have acted more boldly in the face of the global financial crisis. The rise of artificial intelligence makes this a dangerous time, since errors tend to get worse when the economy is changing fast.
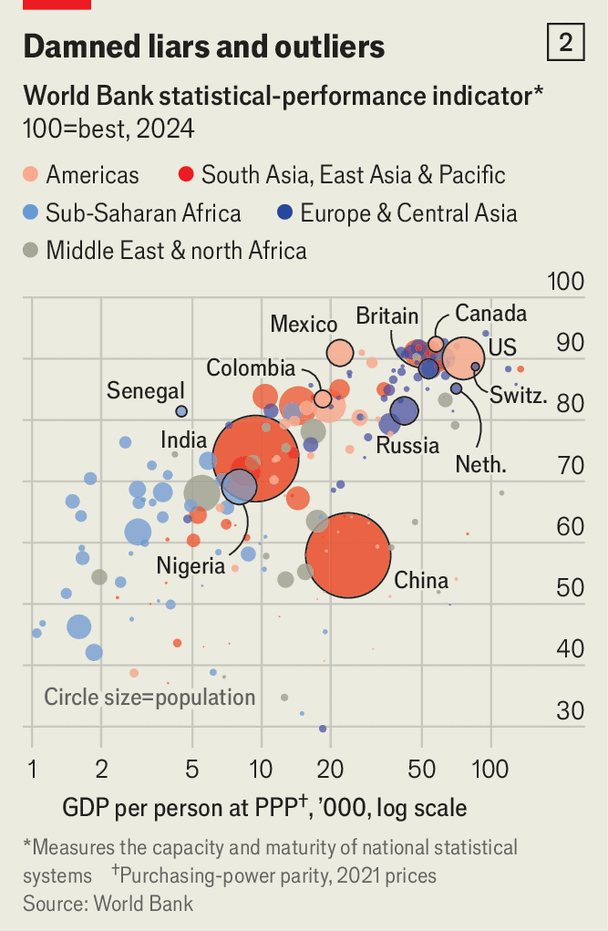
Fortunately, some countries still produce numbers worth trusting. The World Bank compiles an annual index of statistical performance, measuring basic things like how frequently numbers are produced and whether they are available online. The quality of a country’s statistical system is, predictably, closely tied to how rich it is. Low-income countries have an average score of 56, compared with over 80 for high-income ones (see chart 2). Yet although the index does a good job of exposing the weakest performers, the variables it considers are too crude to separate out the best.
To identify the world’s positive statistical outliers, The Economist has devised four tests. The first is the simplest: a country must actually publish statistics, and publish them often. Many poorer countries fall at this hurdle. Lebanon has not held an official census since 1932, when it was under French rule; its politicians fear that counting heads now would reignite ethnic strife. India’s census was postponed in 2020 because of covid-19 but, much less reasonably, it has yet to be completed years after the pandemic ended. Even if it is by next year, as the government promises, that would leave an unacceptable gap of 16 years since the last one.
The second test is that, like Caesar’s wife, statistical offices must be beyond suspicion. That means political independence and transparency. Authoritarian states do badly on this measure. Luis Martínez, now at Emory University, used satellite data on night-time light usage as a proxy to verify whether authoritarian countries were overreporting GDP figures. His paper in 2022 found that they typically overstate yearly growth by about 35%. China is infamously tight-lipped about the workings behind its statistics. Many external observers think that the state massages the numbers, smoothing growth and understating unemployment in the world’s second-biggest economy.
Alarmingly, some rich democracies fail the independence test, too. America is the most depressing example. Mr Trump’s interference goes well beyond firing one senior civil servant. In August the Census Bureau published a politically motivated paper purporting to show that non-citizens had been voting illegally. Statisticians have warned that the report did not go through a proper internal peer review and contained serious errors. The federal government has stopped publishing a range of numbers, from gender and ethnicity splits in many surveys to the annual report on household food security. Some series were caught up in Mr Trump’s anti-woke crusade. Others suffered from cuts to agencies’ budgets; headcount at the BLS has fallen by 20% since 2024, and by nearly 40% in the team crunching agricultural statistics.
It is not enough to produce statistics frequently and without fear or favour. A good system also needs to consistently get the numbers right. Nobody thinks Britain’s Office for National Statistics (ONS) is a stooge for the prime minister. Yet the body’s reputation has taken a beating recently. Publication of its Labour Force Survey had to be suspended in 2023 because of low response rates. The Resolution Foundation, a think-tank, reckons the survey undercounted employment in early 2024 by about 1m people. Although the ONS is recovering its credibility, such basic errors rule it out for a spot on the podium.
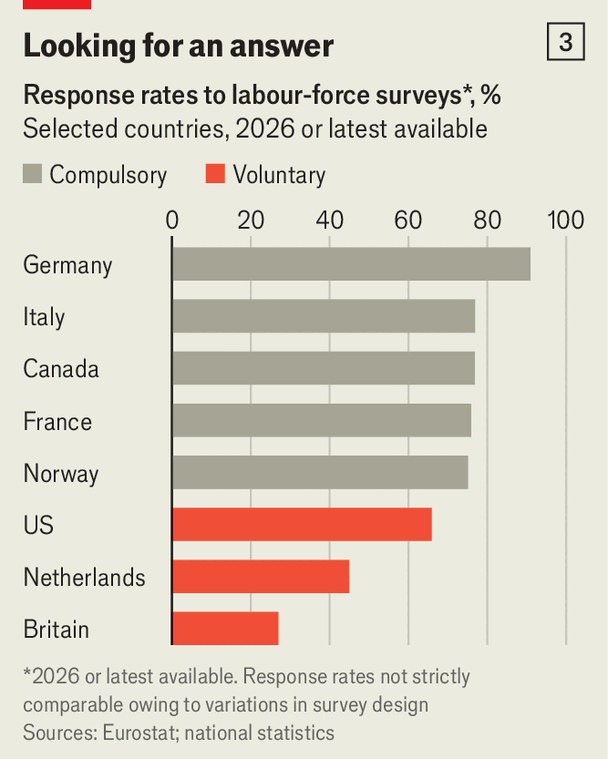
Britain’s problems stem in part from its reliance on voluntary surveys. The quality of these has suffered in recent decades as people have stopped answering their phones and become less willing to fill out long forms. One solution is to make surveys mandatory. Responses rates in countries which do this, like Canada and Germany, remain much higher (see chart 3). A bigger prize still comes in greater use of administrative data, like tax records, which can provide a much more granular picture.
The gold standard is a population register, which lets the government track each citizen’s demographic details in real time using a unique ID number. If updated regularly and thoroughly, such tools reduce the uncertainty associated with surveying. They also enable incredibly sophisticated analysis, allowing statisticians to trace individuals through time. Academics feast on Scandinavian data, where population registers are the norm.
The top-tier of statistics agencies either keep population registers, like the Netherlands, Norway and Switzerland, or have developed innovative ways to link up administrative data, like Canada. This predictable group of rich, cohesive societies faces a final test: how well do they keep up with a fast-changing world? Counting the cars a factory churns out is easy; measuring amorphous economic activity like social-media content is not. AI models are improving so rapidly that statisticians struggle to work out how much price changes reflect inflation as opposed to higher-quality products. Diane Coyle of Cambridge University points out that statisticians are “temperamentally conservative” and like “continuity”. Being innovative is “quite the leadership challenge”.
Some countries are giving it a good go. Canada has used satellite imagery to work out which crops are growing on agricultural land. Switzerland has made it easy for machines to read its data and catalogued everything the government collects on a single, standardised platform. Even Britain, for all its trouble with core statistics, is pioneering ways to measure AI’s economic impact. Recognising that decades-old classifications of industries and the like cannot capture the effects of a genuinely new general-purpose technology, it is developing a new measure that covers the AI industry, from chips to apps.
Given that the best agencies all reliably produce reliable numbers, they are hard to rank on the first three criteria. But on adaptability and innovation, one country edges out the rest. The Netherlands’ Central Bureau of Statistics was using supermarket scanner data to collect food prices as far back as 2002 (it took Britain until this year to copy them). More recently it has developed a machine-learning model that scrapes text from businesses’ websites to determine which are AI companies.
The Dutch model rests on a history of high trust. Because citizens have long consented to the state keeping a granular population register, the government is less reliant on official questionnaires, which suffer from low response rates (below 50% for the Dutch labour-force survey, compared with nearly 70% in America and over 90% in Germany). It has even scrapped the conventional census.
The biggest challenge for statistical offices in the coming years will be to experiment with AI, to link up data sets and to do this while reassuring the citizenry that it can be done without compromising privacy. This is tricky even for the Dutch. A long-running scandal over a rogue tax-authority algorithm that branded innocent child-benefit claimants as fraudsters dented confidence. Only 34% of Dutch people believe that the government will protect their personal information when using AI, according to a survey by the OECD club mostly of rich countries. To allay such worries, the Dutch authorities now log every time someone views an individual’s data, and the person in question can ask to see the log. Unlike King Ariantas, modern statisticians cannot threaten violence to get the people’s buy-in. They must earn it.


